APPENDIX A:
Sample Idealized System Diagram
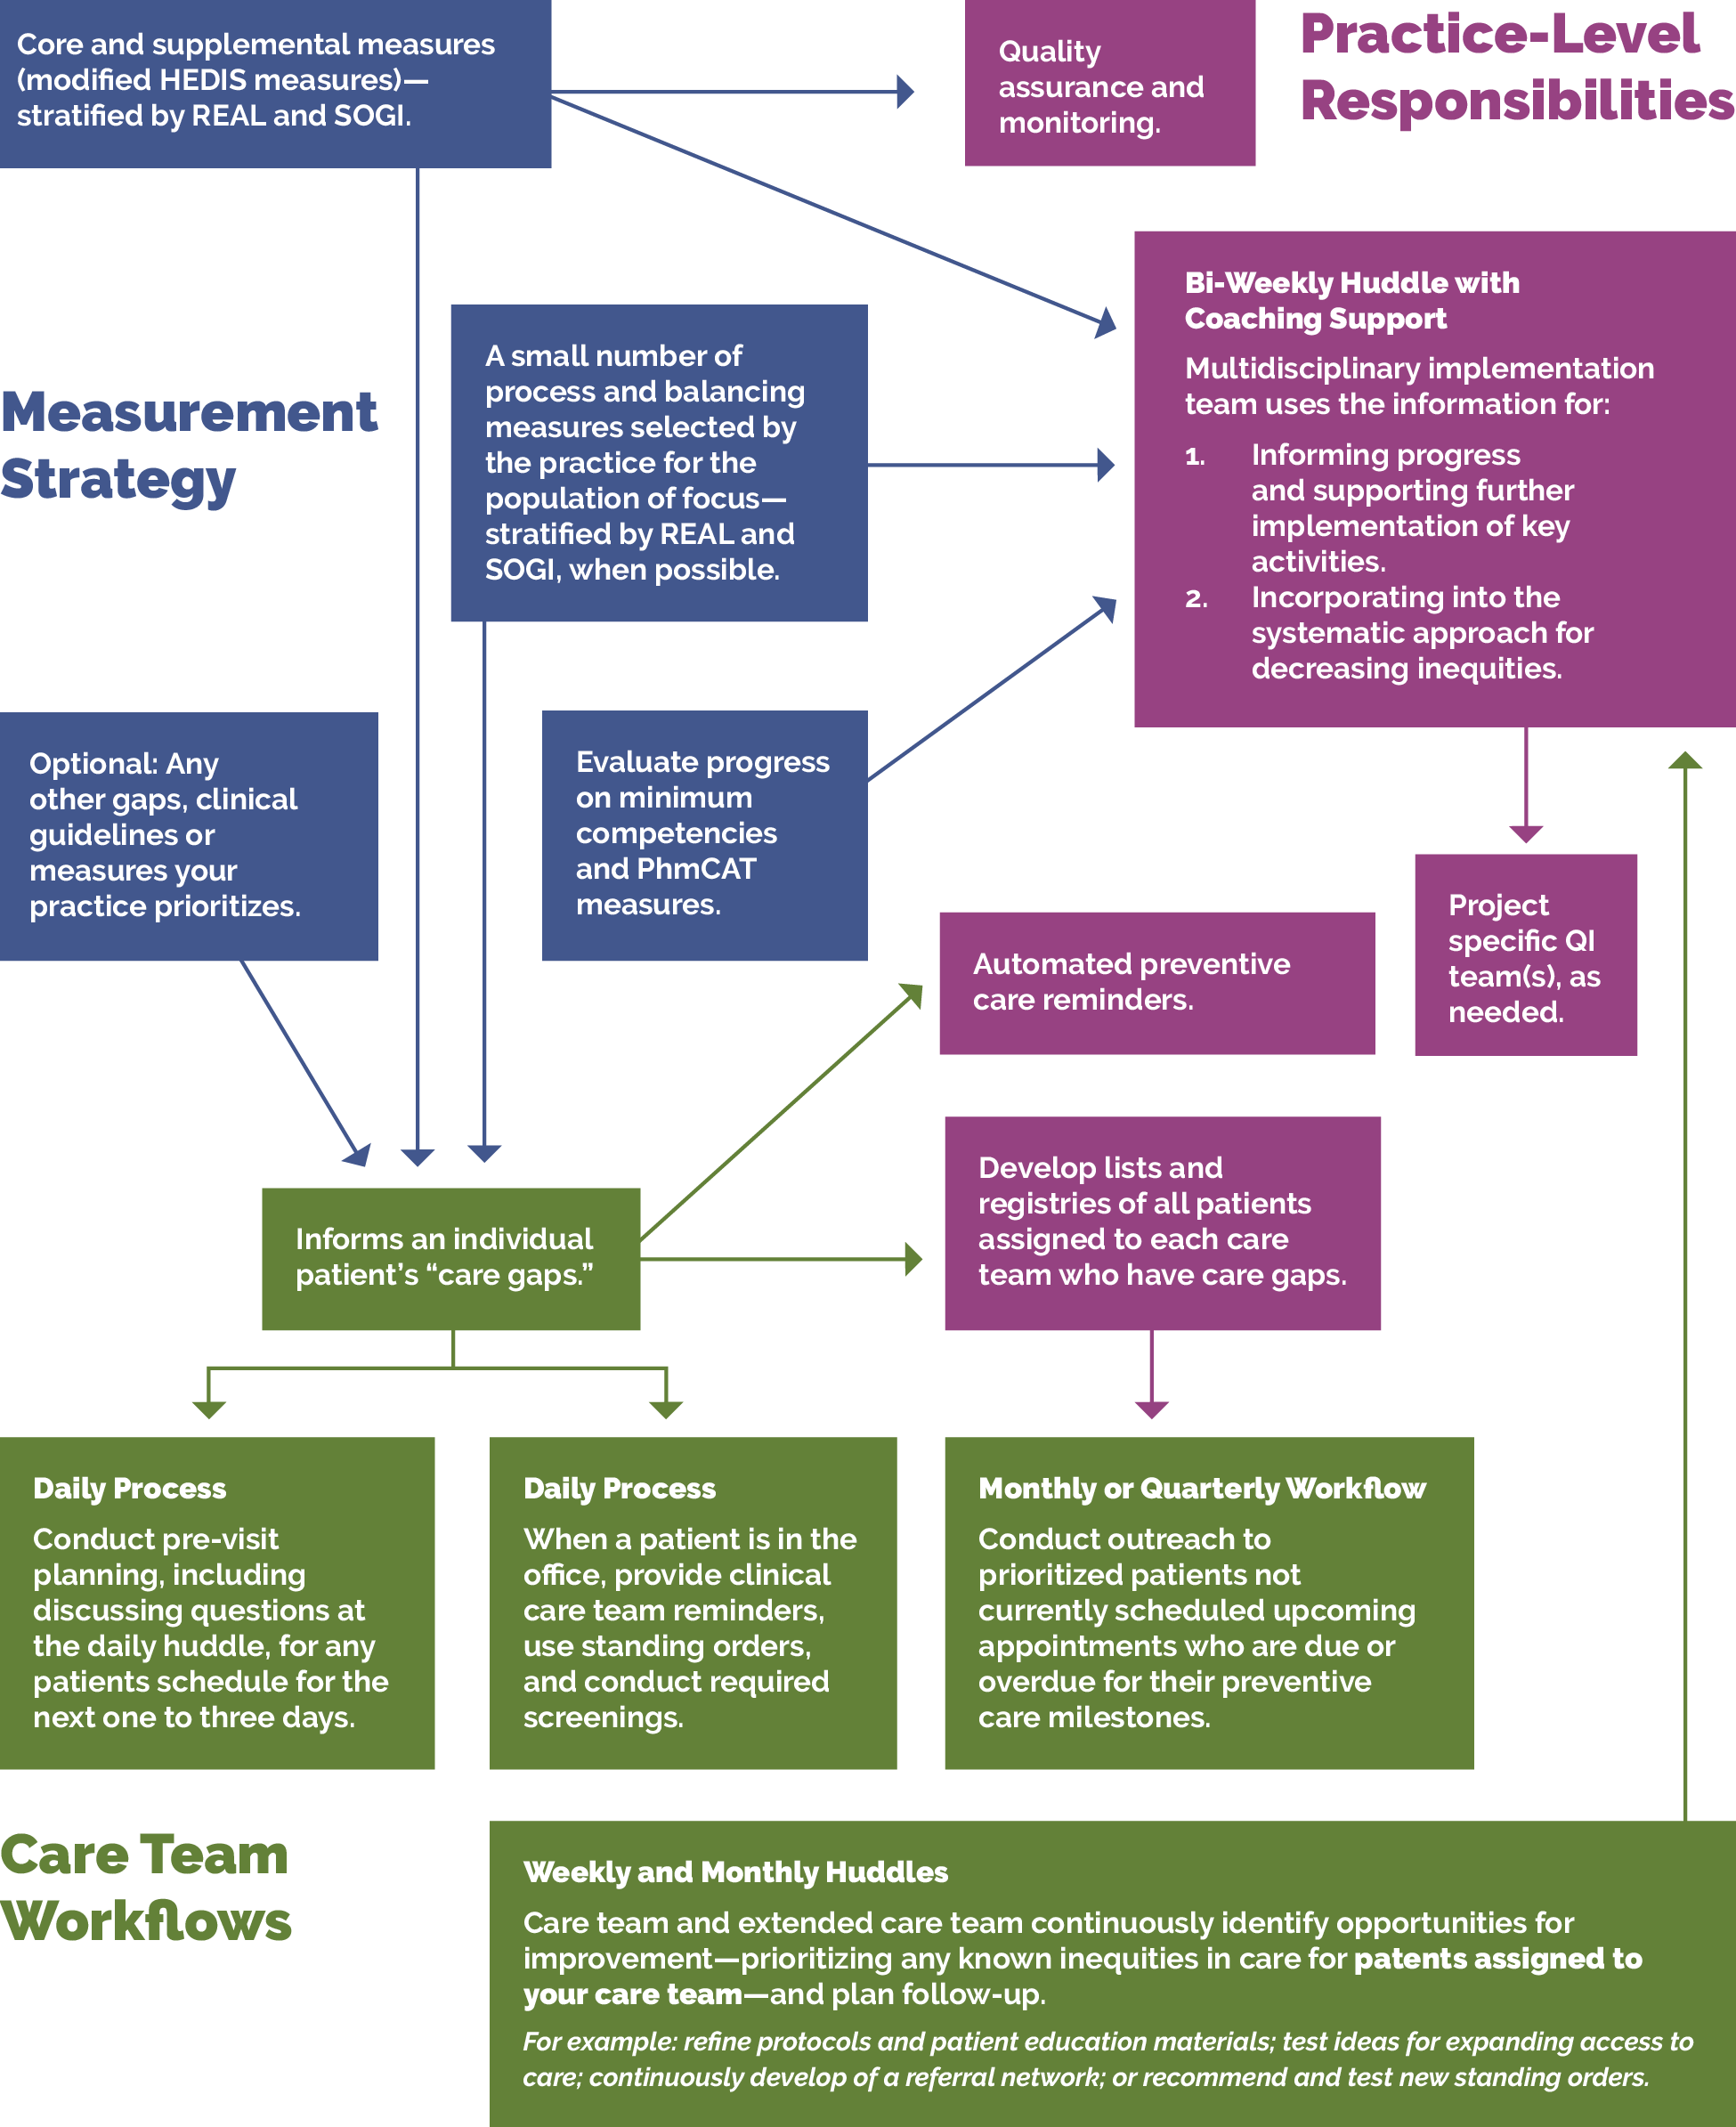
FIGURE 21: WEAVING YOUR MEASUREMENT STRATEGY AND LEARNING SYSTEM INTO PRACTICE OPERATIONS
The below graphic provides an example to visualize the flow of information between a practice’s measurement strategy and actions at the practice and care team levels, including how to use the information for continual learning and improvement.