Data Quality and Reporting Resource 3:
Measure Calculation and Reporting
©️ 2024 Kaiser Foundation Health Plan, Inc.
This resource is part of the Data Quality & Reporting Implementation Guide, offering steps and activities to ensure your practice is capable of reporting valid and reliable data for selected population health measures. It is the first in the “Building the Foundation” series of implementation guides.
This document supports community health centers (CHCs) in evaluating their capacity to produce and report core HEDIS measures for PHMI with fidelity to PHMI/HEDIS specifications.
Overview
Population Health Management Initiative (PHMI) core measures were selected to align with metrics for alternative payment methodology (APM) and Medi-Cal managed care plan (MCP) pay-for-performance (P4P) programs to prepare CHCs for success in these value-based reimbursement structures. To optimize performance in these programs, HEDIS measures for PHMI utilize the Healthcare Effectiveness Data and Information Set (HEDIS) specifications, which are the measures used in APM and MCP P4P with some modifications for PHMI.
For many CHCs, HEDIS measurement is a shift from the more familiar Uniform Data System (UDS) measures CHCs routinely report to the Health Resources and Services Administration (HRSA). One key difference is that HEDIS measures capture all patients who are assigned to the CHC from a health plan including those who have not had an encounter at the CHC. In contrast, UDS measures capture only patients who have had an encounter at the CHC within the year. HEDIS provides an examination of the population that the CHC is responsible for and identifies opportunities for engagement and improvement in their care. Understanding the importance of this new measurement set requires education and role setting across the CHC.
This measure calculation and reporting process document supports CHCs in evaluating their capacity to produce and report core HEDIS measures for PHMI with fidelity to PHMI/HEDIS specifications.
Processes developed should be based on the following:
- An understanding of how the CHC is running or coding the measures.
- The resources available or being used by them (e.g., EHR, PHM platform).
- Key steps and sequencing for improving calculation with greater fidelity to HEDIS specifications.
Working with their practice coaches and subject matter experts (SME), CHCs can use this document to better understand their current HEDIS measure calculation, reporting capabilities and gaps, and steps to improve capacity toward greater alignment and fidelity with APM and MCP P4P measurement.
Measure Calculation and Reporting Process Guidelines
Working with their practice coach and subject matter experts, CHCs should follow a defined process to identify current calculation processes, assess gaps, and define steps going forward to improve calculation and reporting of the core HEDIS measures for PHMI. The following general process can be tailored for each CHC based on their specific factors (e.g., data analytics systems available).
Step 1: Assess current understanding of PHMI/HEDIS measurement.
- Relevant staff at the CHC (e.g., the data/analytics team) should aim to have a solid understanding of HEDIS measurement (See Data Quality and Reporting Resource 2: Core Measure Specifications Manual tool), including HEDIS specifications and associated value sets and PHMI modifications.
Step 2: Review current processes for calculating measures, if any.
- For each core measure, review current system(s) used or available to calculate measures and any upcoming changes to that capacity (e.g., plans to adopt new systems and timeline).
- Within that system(s), review current specifications used or available to calculate measures, and determine whether it is NCQA-certified according to NCQA’s certification process for software that calculates HEDIS measures. (A directory of vendors that have earned measure certification can be accessed here.)
- Identify all data sources captured by the metrics.
Step 3: Determine gaps for each measure; assess fidelity to PHMI/HEDIS specifications.
- Evaluate if the CHC has system or capability needs to be addressed.
- Review gaps in demographic data (e.g., race and ethnicity), coding, structure setup and ongoing process.
- Assess whether modifications can be made to existing systems/specifications used, or whether alternate processes would be needed.
- Use Figure 3.1 Measure Calculation Checklist provided below to assess current processes and gaps.
Step 4: Develop action plan and timeline for improving calculation.
The action plan could include:
- Modify existing systems/specifications.
- Seek alternate measure calculation solutions (e.g., analytics platforms, RAC support).
- Write code for manual measure calculation.
- Implement recommendations on coding, structure setup and an ongoing process going forward.
- Plan to ensure ongoing sustainability:
- Develop policies and procedures to ensure ongoing oversight of measurement calculation, periodic (annual) review of specifications and making modifications as needed, etc.
- Develop or adapt a step-by-step guide on measure calculation.
FIGURE 3.1: MEASURE CALCULATION CHECKLIST
Measure |
Calculation Criteria |
Y/N |
Notes |
|---|---|---|---|
Hemoglobin A1c Control in Patients With Diabetes (Poor Control >9%) |
System/Calculation Methodology |
||
An analytics platform is available/in use to calculate the measure. |
|||
System is NCQA-certified (if yes, further assessment for this measure is not needed). |
|||
System utilizes HEDIS or HEDIS-like specifications (but is non-NCQA certified). |
|||
If no, does CHC have or is it considering another platform/system? (If it is, assess steps above for the alternate system.) |
|||
The CHC intends to manually calculate the measure. |
|||
|
Fidelity to Specifications [1] |
|||
The system/calculation methodology can accurately identify diabetic or pre-diabetic patients (denominator). |
|||
The system/calculation methodology can accurately identify measure exclusions. |
|||
The system/calculation methodology can accurately identify HbA1c test results >9% and missing values (numerator). |
|||
The system/calculation methodology can accurately calculate the rate for the appropriate reporting period (e.g., quarterly, rolling). |
|||
The system/calculation methodology can accurately calculate the subpopulations (e.g., race/ethnicity, site). |
|||
If no to any of the above, the system/calculation methodology can be modified to accurately identify the needed component. |
|||
Controlling High Blood Pressure |
System/Calculation Methodology |
||
An analytics platform is available/in use to calculate the measure. |
|||
System is NCQA-certified (if yes, further assessment for this measure is not needed). |
|||
System utilizes HEDIS or HEDIS-like specifications (but is non-NCQA certified). |
|||
If no, does CHC have or is it considering another platform/system? (If it is, assess steps above for the alternate system.) |
|||
The CHC intends to manually calculate the measure. |
|||
Fidelity to Specifications |
|||
The system/calculation methodology can accurately identify hypertensive patients (denominator). |
|||
The system/calculation methodology can accurately identify measure exclusions. |
|||
The system/calculation methodology can accurately identify blood pressure results <140/90 mm Hg (numerator). |
|||
The system/calculation methodology can accurately calculate the rate for the appropriate reporting period (e.g., quarterly, rolling). |
|||
The system/calculation methodology can accurately calculate the subpopulations (e.g., race/ethnicity, site). |
|||
If no to any of the above, the system/calculation methodology can be modified to accurately identify the needed component. |
|||
Prenatal and Postpartum Care (Postpartum) |
System/Calculation Methodology |
||
An analytics platform is available/in use to calculate the measure. |
|||
System is NCQA-certified (if yes, further assessment for this measure is not needed). |
|||
System utilizes HEDIS or HEDIS-like specifications (but is non-NCQA certified). |
|||
If no, does CHC have or is it considering another platform/system? (If it is, assess steps above for the alternate system.) |
|||
The CHC intends to manually calculate the measure. |
|||
Fidelity to Specifications |
|||
The system/calculation methodology can accurately identify patients with a live birth (denominator). |
|||
The system/calculation methodology can accurately identify measure exclusions. |
|||
The system/calculation methodology can accurately identify postpartum visits (numerator). |
|||
The system/calculation methodology can accurately calculate the rate for the appropriate reporting period (e.g., quarterly, rolling). |
|||
The system/calculation methodology can accurately calculate the subpopulations (e.g., race/ethnicity, site). |
|||
If no to any of the above, the system/calculation methodology can be modified to accurately identify the needed component. |
|||
Colorectal Cancer Screening |
System/Calculation Methodology |
||
An analytics platform is available/in use to calculate the measure. |
|||
System is NCQA-certified (if yes, further assessment for this measure is not needed). |
|||
System utilizes HEDIS or HEDIS-like specifications (but is non-NCQA certified). |
|||
If no, does CHC have or is it considering another platform/system? (If it is, assess steps above for the alternate system.) |
|||
The CHC intends to manually calculate the measure. |
|||
Fidelity to Specifications |
|||
The system/calculation methodology can accurately identify patients aged 45 to 75 (denominator). |
|||
The system/calculation methodology can accurately identify measure exclusions. |
|||
The system/calculation methodology can accurately identify colorectal cancer screenings and date (numerator). |
|||
The system/calculation methodology can accurately calculate the rate for the appropriate reporting period (e.g., quarterly, rolling). |
|||
The system/calculation methodology can accurately calculate the subpopulations (e.g., race/ethnicity, site). |
|||
If no to any of the above, the system/calculation methodology can be modified to accurately identify the needed component. |
|||
Well Child Visits in the First 30 Months of Life (First 15 Months) |
System/Calculation Methodology |
||
An analytics platform is available/in use to calculate the measure. |
|||
System is NCQA-certified (if yes, further assessment for this measure is not needed). |
|||
System utilizes HEDIS or HEDIS-like specifications (but is non-NCQA certified). |
|||
If no, does CHC have or is it considering another platform/system? (If it is, assess steps above for the alternate system.) |
|||
The CHC intends to manually calculate the measure. |
|||
Fidelity to Specifications |
|||
The system/calculation methodology can accurately identify patients aged 15 months (denominator). |
|||
The system/calculation methodology can accurately identify measure exclusions. |
|||
The system/calculation methodology can accurately identify six or more well child visits (numerator). |
|||
The system/calculation methodology can accurately calculate the rate for the appropriate reporting period (e.g., quarterly, rolling). |
|||
The system/calculation methodology can accurately calculate the subpopulations (i.e., race/ethnicity, site). |
|||
If no to any of the above, the system/calculation methodology can be modified to accurately identify the needed component. |
|||
Child Immunization Status (Combo 10) |
System/Calculation Methodology |
||
An analytics platform is available/in use to calculate the measure. |
|||
System is NCQA-certified (if yes, further assessment for this measure is not needed). |
|||
System utilizes HEDIS or HEDIS-like specifications (but is non-NCQA certified). |
|||
If no, does CHC have or is it considering another platform/system? (If it is, assess steps above for the alternate system.) |
|||
The CHC intends to manually calculate the measure. |
|||
Fidelity to Specifications |
|||
The system/calculation methodology can accurately identify patients aged two years (denominator). |
|||
The system/calculation methodology can accurately identify measure exclusions. |
|||
The system/calculation methodology can accurately identify immunizations and date (numerator). |
|||
The system/calculation methodology can accurately calculate the rate for the appropriate reporting period (e.g., quarterly, rolling). |
|||
The system/calculation methodology can accurately calculate the subpopulations (e.g., race/ethnicity, site). |
|||
If no to any of the above, the system/calculation methodology can be modified to accurately identify the needed component. |
|||
Depression Screening and Follow-Up for Adolescents and Adults |
System/Calculation Methodology |
||
An analytics platform is available/in use to calculate the measure. |
|||
System is NCQA-certified (if yes, further assessment for this measure is not needed). |
|||
System utilizes HEDIS or HEDIS-like specifications (but is non-NCQA certified). |
|||
If no, does CHC have or is it considering another platform/system? (If it is, assess steps above for the alternate system.) |
|||
The CHC intends to manually calculate the measure. |
|||
Fidelity to Specifications |
|||
The system/calculation methodology can accurately identify patients aged 12+ (denominator 1). |
|||
The system/calculation methodology can accurately identify measure exclusions. |
|||
The system/calculation methodology can accurately identify patients aged 12+ with a positive screen on an age-appropriate depression screener (numerator 1 and denominator 2). |
|||
The system/calculation methodology can accurately identify follow up visits within 30 days of positive screen (numerator 2). |
|||
The system/calculation methodology can accurately calculate the rate for the appropriate reporting period (e.g., quarterly, rolling). |
|||
The system/calculation methodology can accurately calculate the subpopulations (e.g., race/ethnicity, site). |
|||
If no to any of the above, the system/calculation methodology can be modified to accurately identify the needed component. |
Measure Calculation Step By Step
After completing the above checklist, CHCs should work with their practice coaches and SMEs to address any gaps. If their platform or system of reporting cannot calculate a measure with fidelity to the PHMI/HEDIS specifications, the CHC should consider whether they will manually calculate the measure.
The below criteria can be used to:
- Identify current gaps in the CHC’s ability to accurately calculate the denominator, the numerator and exclusions indicated in the checklist above.
- Identify basic steps needed to calculate the measure should a manual calculation process be pursued.
FIGURE 3.2: CRITERIA FOR MEASURE CALCULATION: HEMOGLOBIN A1C CONTROL FOR PATIENTS WITH DIABETES
Hemoglobin A1c Control for Patients with Diabetes (Poor Control >9%) [HBD] |
||
|---|---|---|
Identification of diabetic or pre-diabetic patients (denominator) |
|
|
Identification of exclusions |
|
|
Service (and code) measured (numerator) |
|
|
Calculation of measure |
|
|
FIGURE 3.3: CRITERIA FOR MEASURE CALCULATION: CONTROLLING HIGH BLOOD PRESSURE
Controlling High Blood Pressure [CBP] |
||
|---|---|---|
Identification of hypertension patients (denominator) |
|
|
Identification of exclusions |
|
|
Service (and code) measured (numerator) |
|
|
Any patient who has not had a BP reading captured in the measurement year is non-compliant for the measure numerator (and they remain in the denominator). |
||
Calculation of measure |
|
|
|
The rate can be broken down by relevant subpopulation (e.g., race/ethnicity, clinic site). |
||
FIGURE 3.4: CRITERIA FOR MEASURE CALCULATION: PRENATAL AND POSTPARTUM CARE (POSTPARTUM)
Prenatal and Postpartum Care (Postpartum) [PPC] |
||
|---|---|---|
Identification of pregnant patients or live births (denominator) |
|
|
Identification of exclusions |
|
|
Service (and code) measured (numerator) |
|
|
Calculation of measure |
|
|
FIGURE 3.5: CRITERIA FOR MEASURE CALCULATION: COLORECTAL CANCER SCREENING
Colorectal Cancer Screening [COL] |
||
|---|---|---|
Identification of patients 45-75 years of age during the current measurement year (denominator) |
|
|
Identification of exclusions |
|
|
Service (and code) measured (numerator) |
|
|
Calculation of measure |
|
|
FIGURE 3.6: CRITERIA FOR MEASURE CALCULATION: WELL CHILD VISITS IN THE FIRST 30 MONTHS OF LIFE
Well Child Visits in the First 30 Months of Life (First 15 Months) [WC15] |
||
|---|---|---|
Identification of patients who have turned 15 months of age during the measurement year (denominator) |
|
|
Identification of exclusions |
|
|
Service (and code) measured (numerator) |
|
|
Calculation of measure |
|
|
FIGURE 3.7: CRITERIA FOR MEASURE CALCULATION: CHILD IMMUNIZATION STATUS
Child Immunization Status [Combination 10] |
||
|---|---|---|
Identification of patients who have turned two years of age during the current year (denominator) |
|
|
Identification of exclusions |
|
|
Service (and code) measured (numerator) |
|
|
Calculation of measure |
|
|
FIGURE 3.8: CRITERIA FOR MEASURE CALCULATION: DEPRESSION SCREENING AND FOLLOW-UP FOR ADOLESCENTS AND ADULTS
Depression Screening and Follow-Up for Adolescents and Adults [DSF-E] |
||
|---|---|---|
Identification of patients 12 years of age or older at the start of the measurement year (denominator 1) |
|
|
Identification of exclusions |
|
|
Service (and code) measured (numerator 1 and denominator 2) |
|
|
Service (and code) measured (numerator 2) |
|
|
Calculation of sub-measure 1 |
|
|
Calculation of sub-measure 2 |
|
|
Measurement Reporting and Monitoring
Developing and utilizing reporting mechanisms that provide relevant stakeholders with access to timely and relevant data is a key function. Comparative data is needed to understand how CHCs are tracking and trending in overall performance and amongst sub-groups. CHCs should utilize their calculated rates to create processes for ongoing reporting to proactively monitor care and identify opportunities for improvement.
Best practice features of reports include:
- Segmenting rates by sub-populations such as patient race/ethnicity, and site-level and clinician-level reports to monitor discrepancies in rates and health inequities among groups.
- Producing year-to-date (YTD) rates in addition to 12-month rolling measurement. While rolling measurement is used by PHMI to track improvement throughout the year, additional YTD reporting is a best practice that should be considered. This aligns with HEDIS, P4P and APM methodologies and builds population health capacities by tracking patients and planning services based on patients who will be part of measures throughout the course of the year (e.g., tracking all patients who will turn 2 during the calendar year allows for advance planning and practice management around their immunization needs/schedules).
- Comparing benchmarks.
- Comparing prior time periods.
- Comparing to peers (for clinicians) or similar organizations/sites.
- Reviewing patient-level drill-down reports.
- Tracking comparisons using cascading goals that calculate the number of patient services (gaps) needed to reach goals.
- Testing statistical significance to determine if change over time and/or rates by subpopulations is significantly different.
- Setting realistic internal targets for continuous improvement.
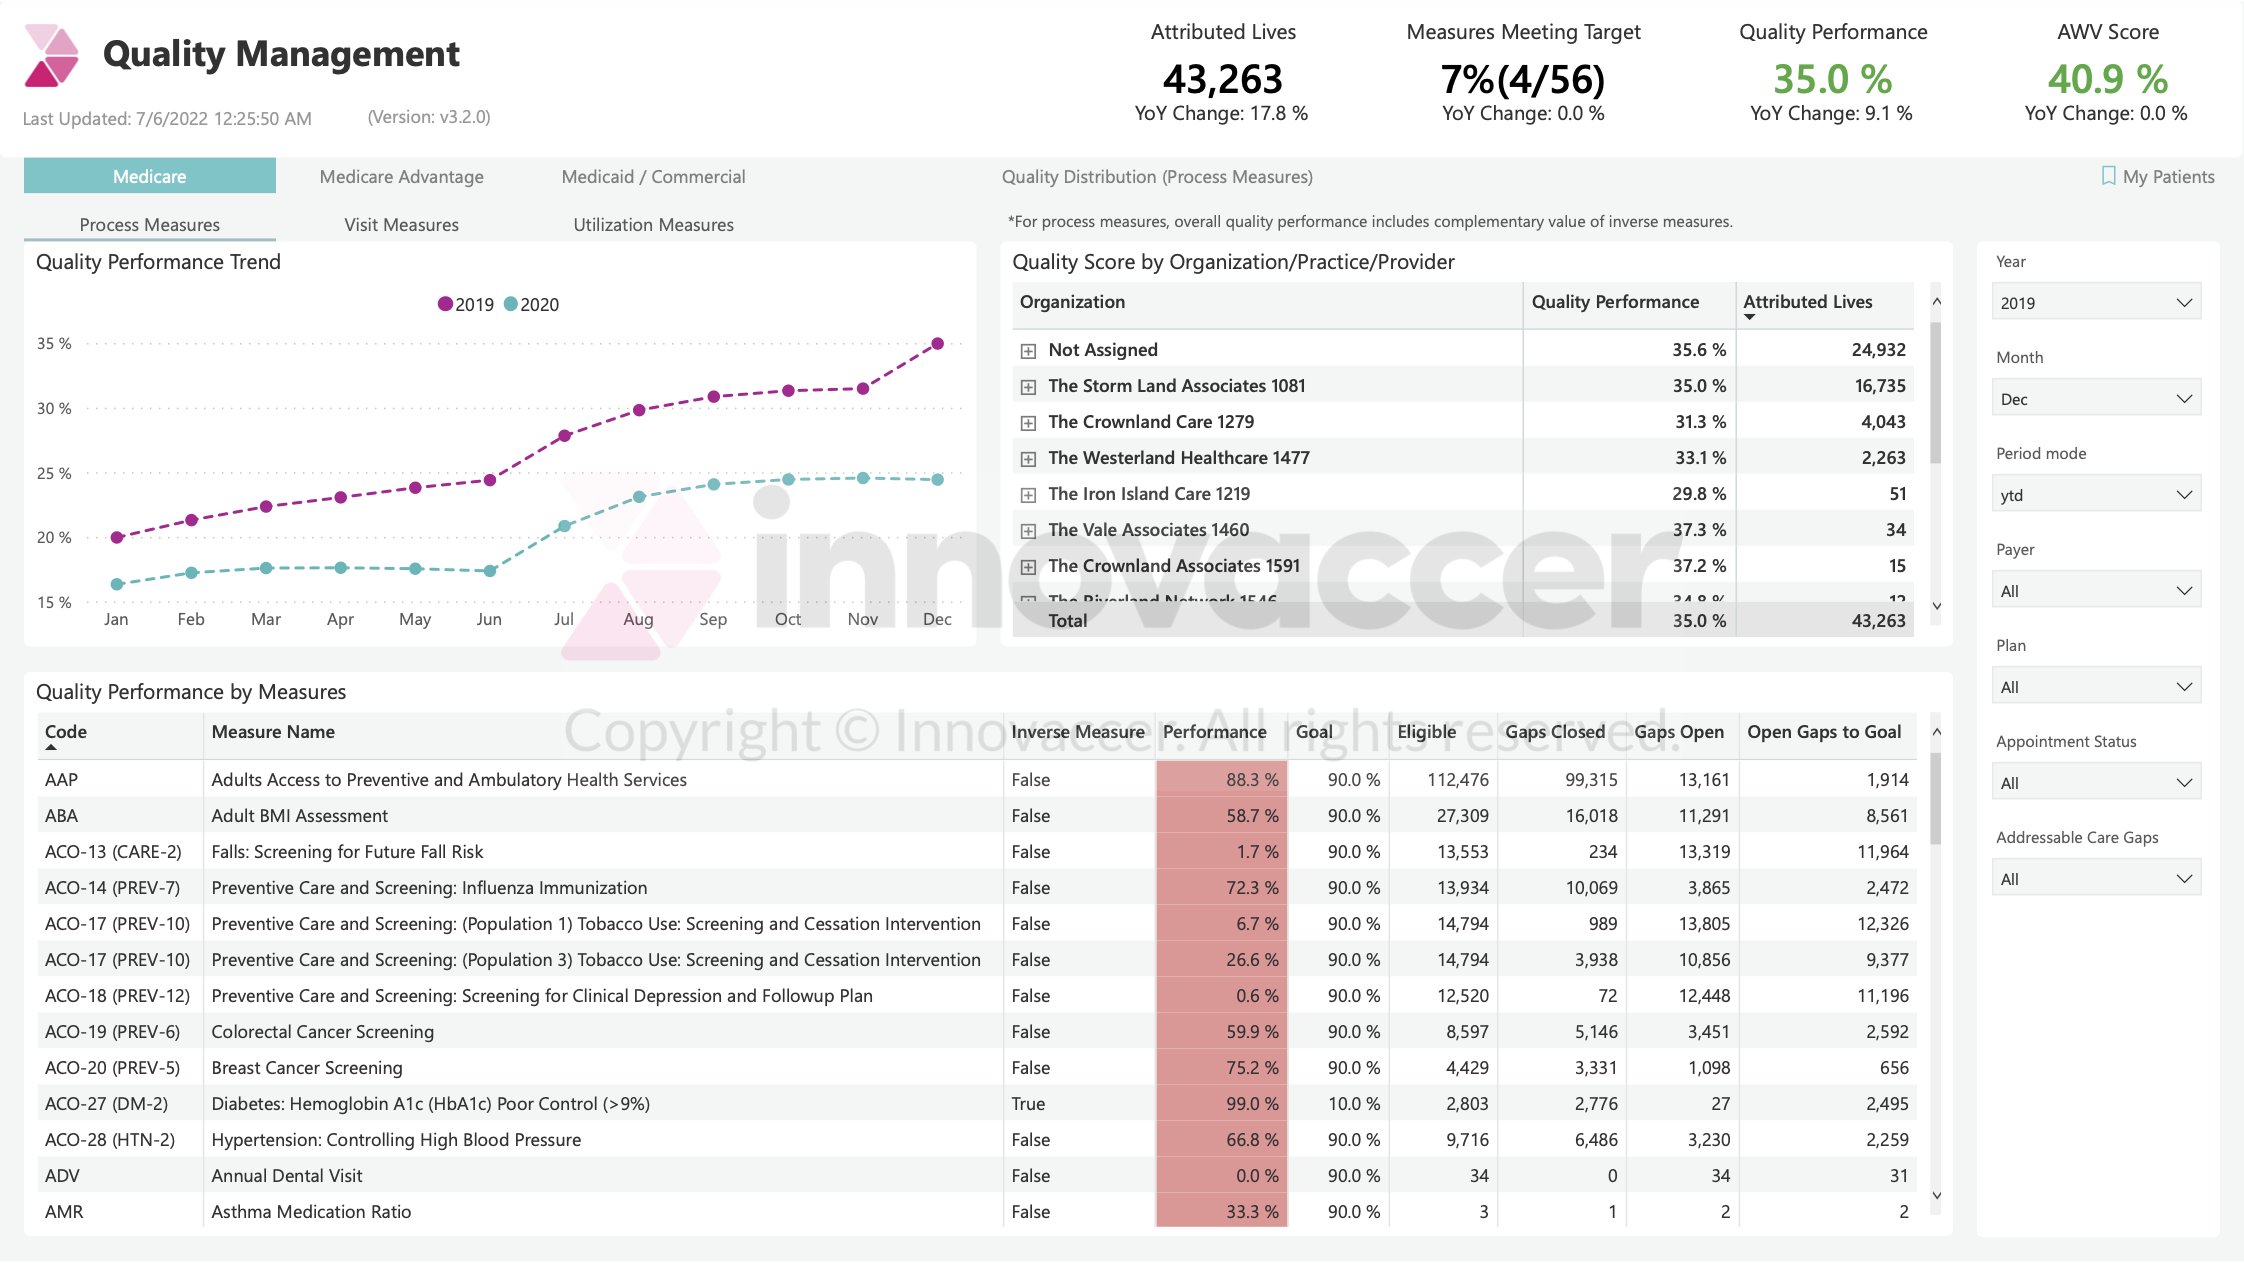
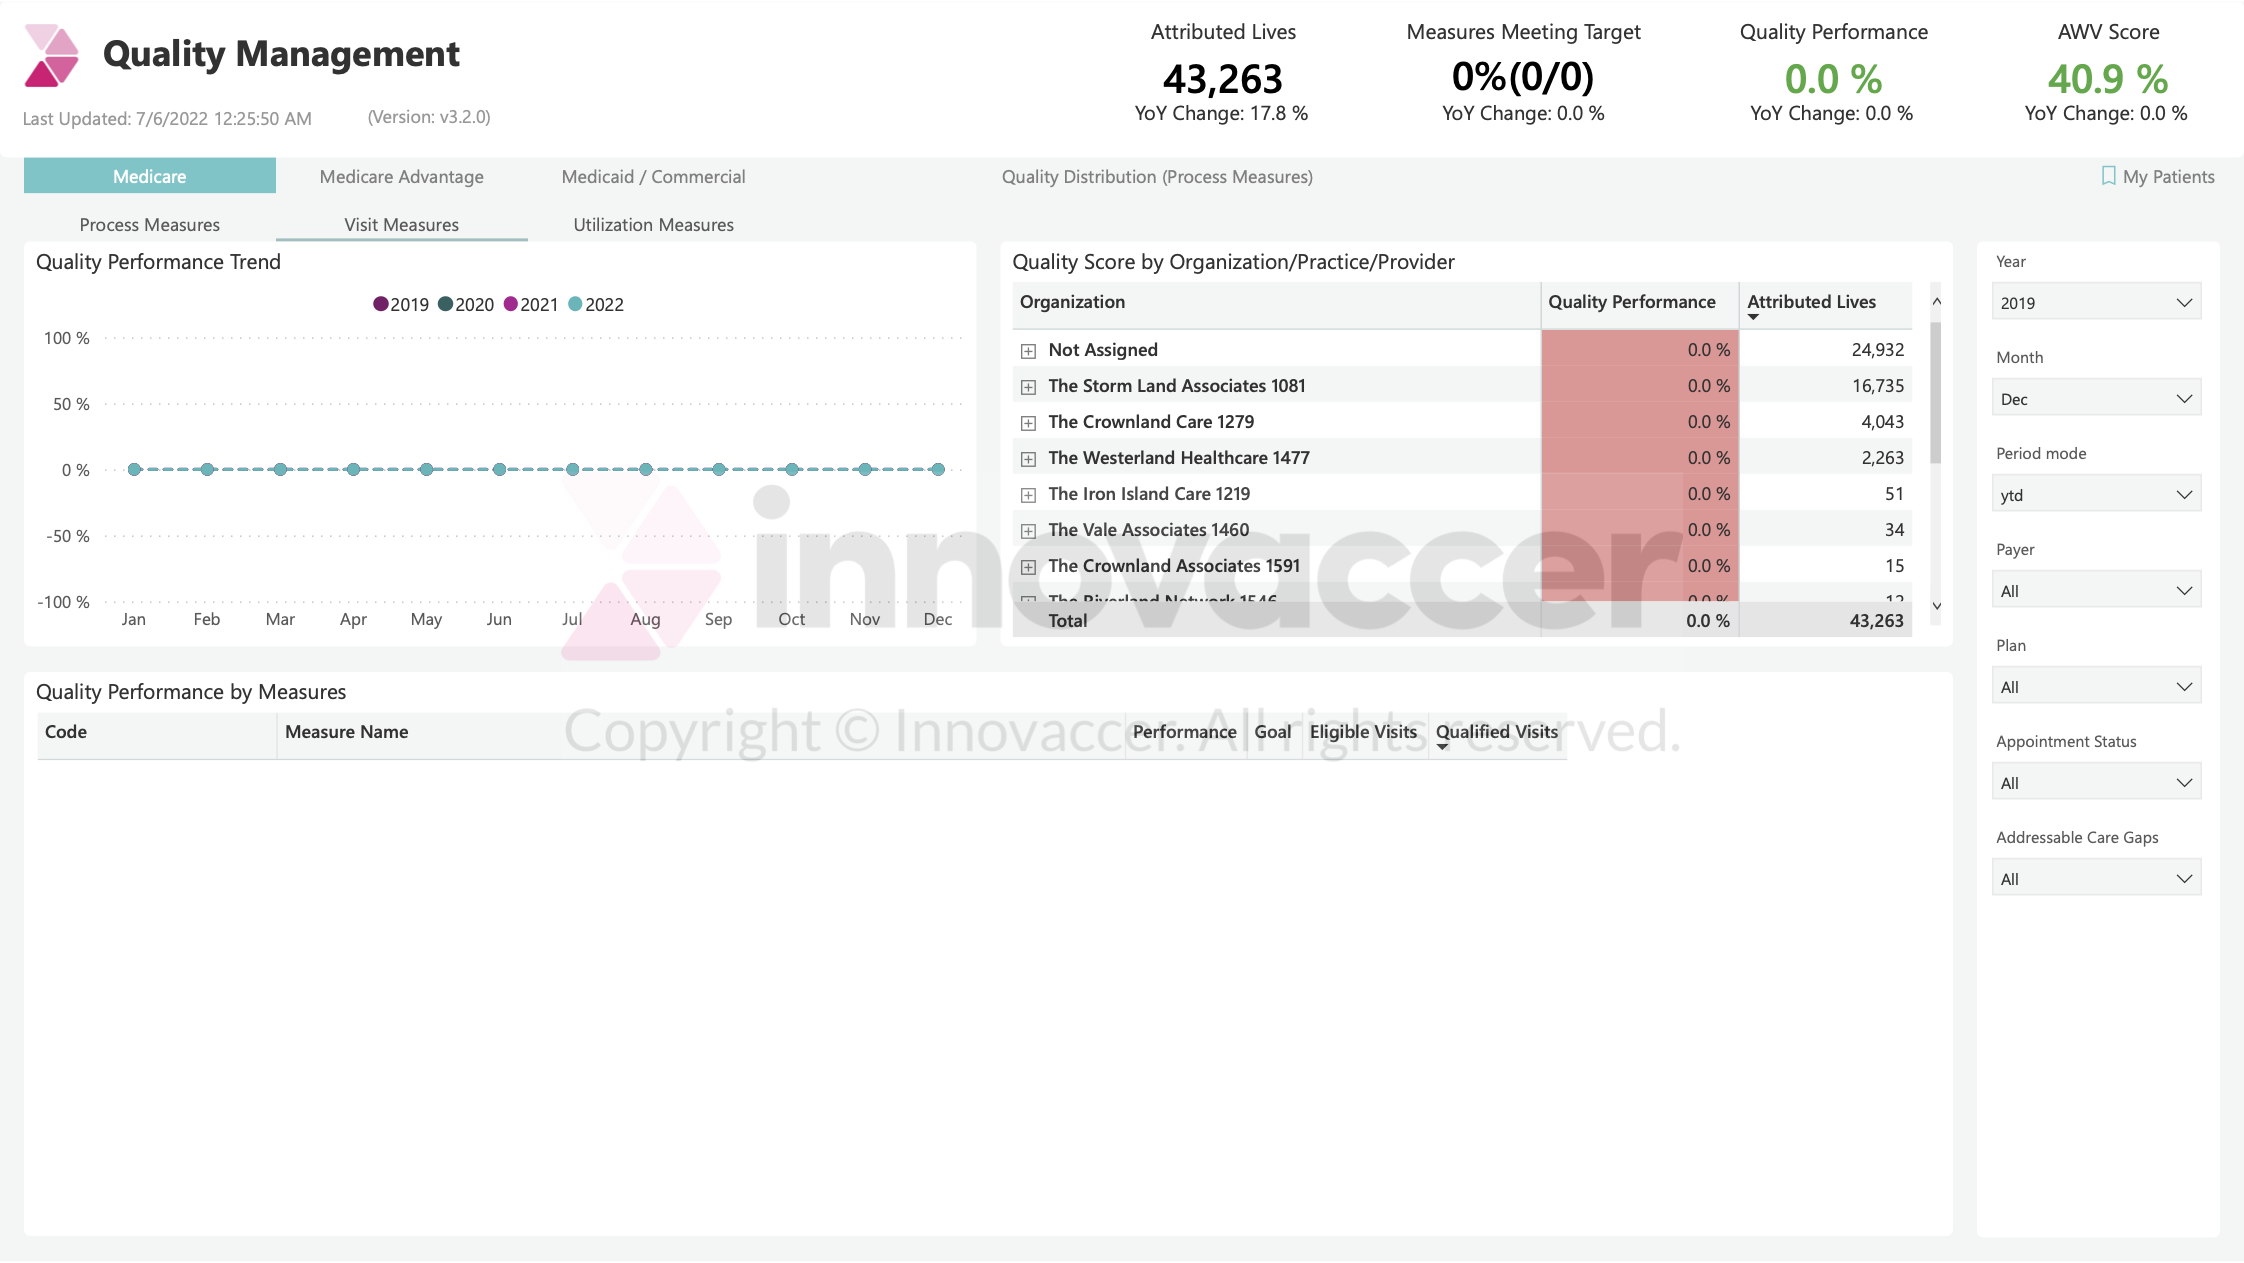
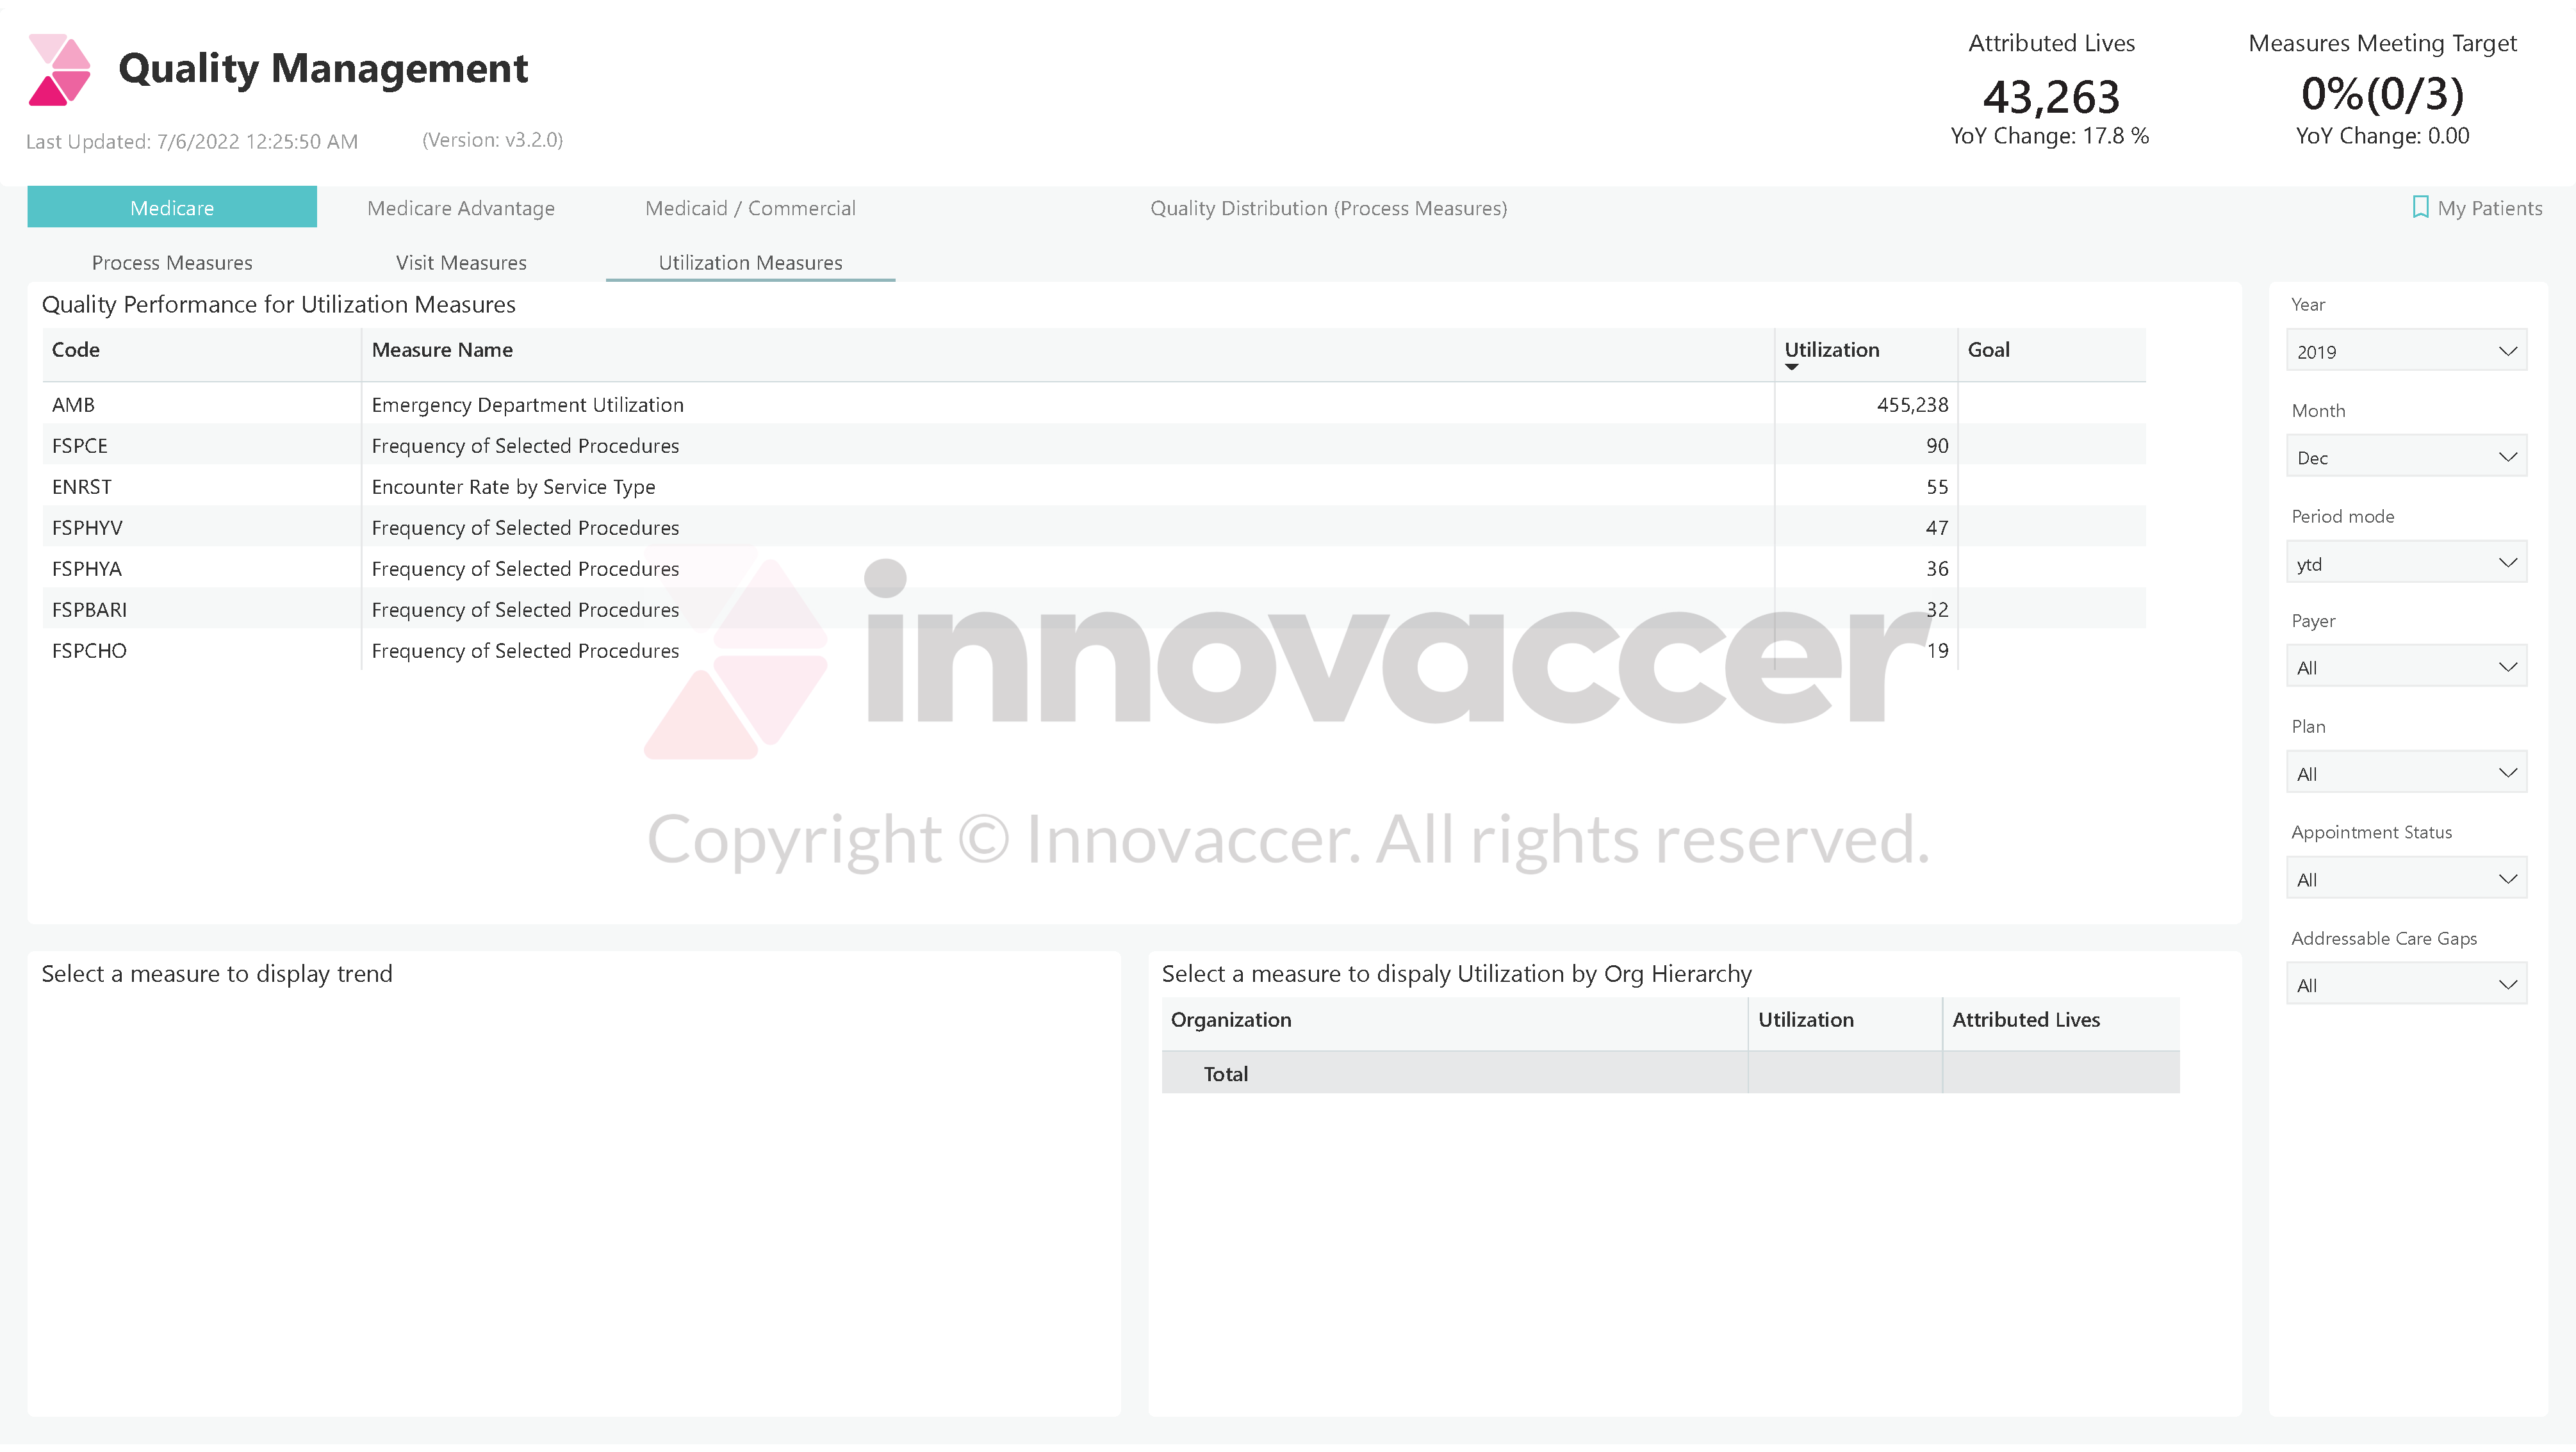
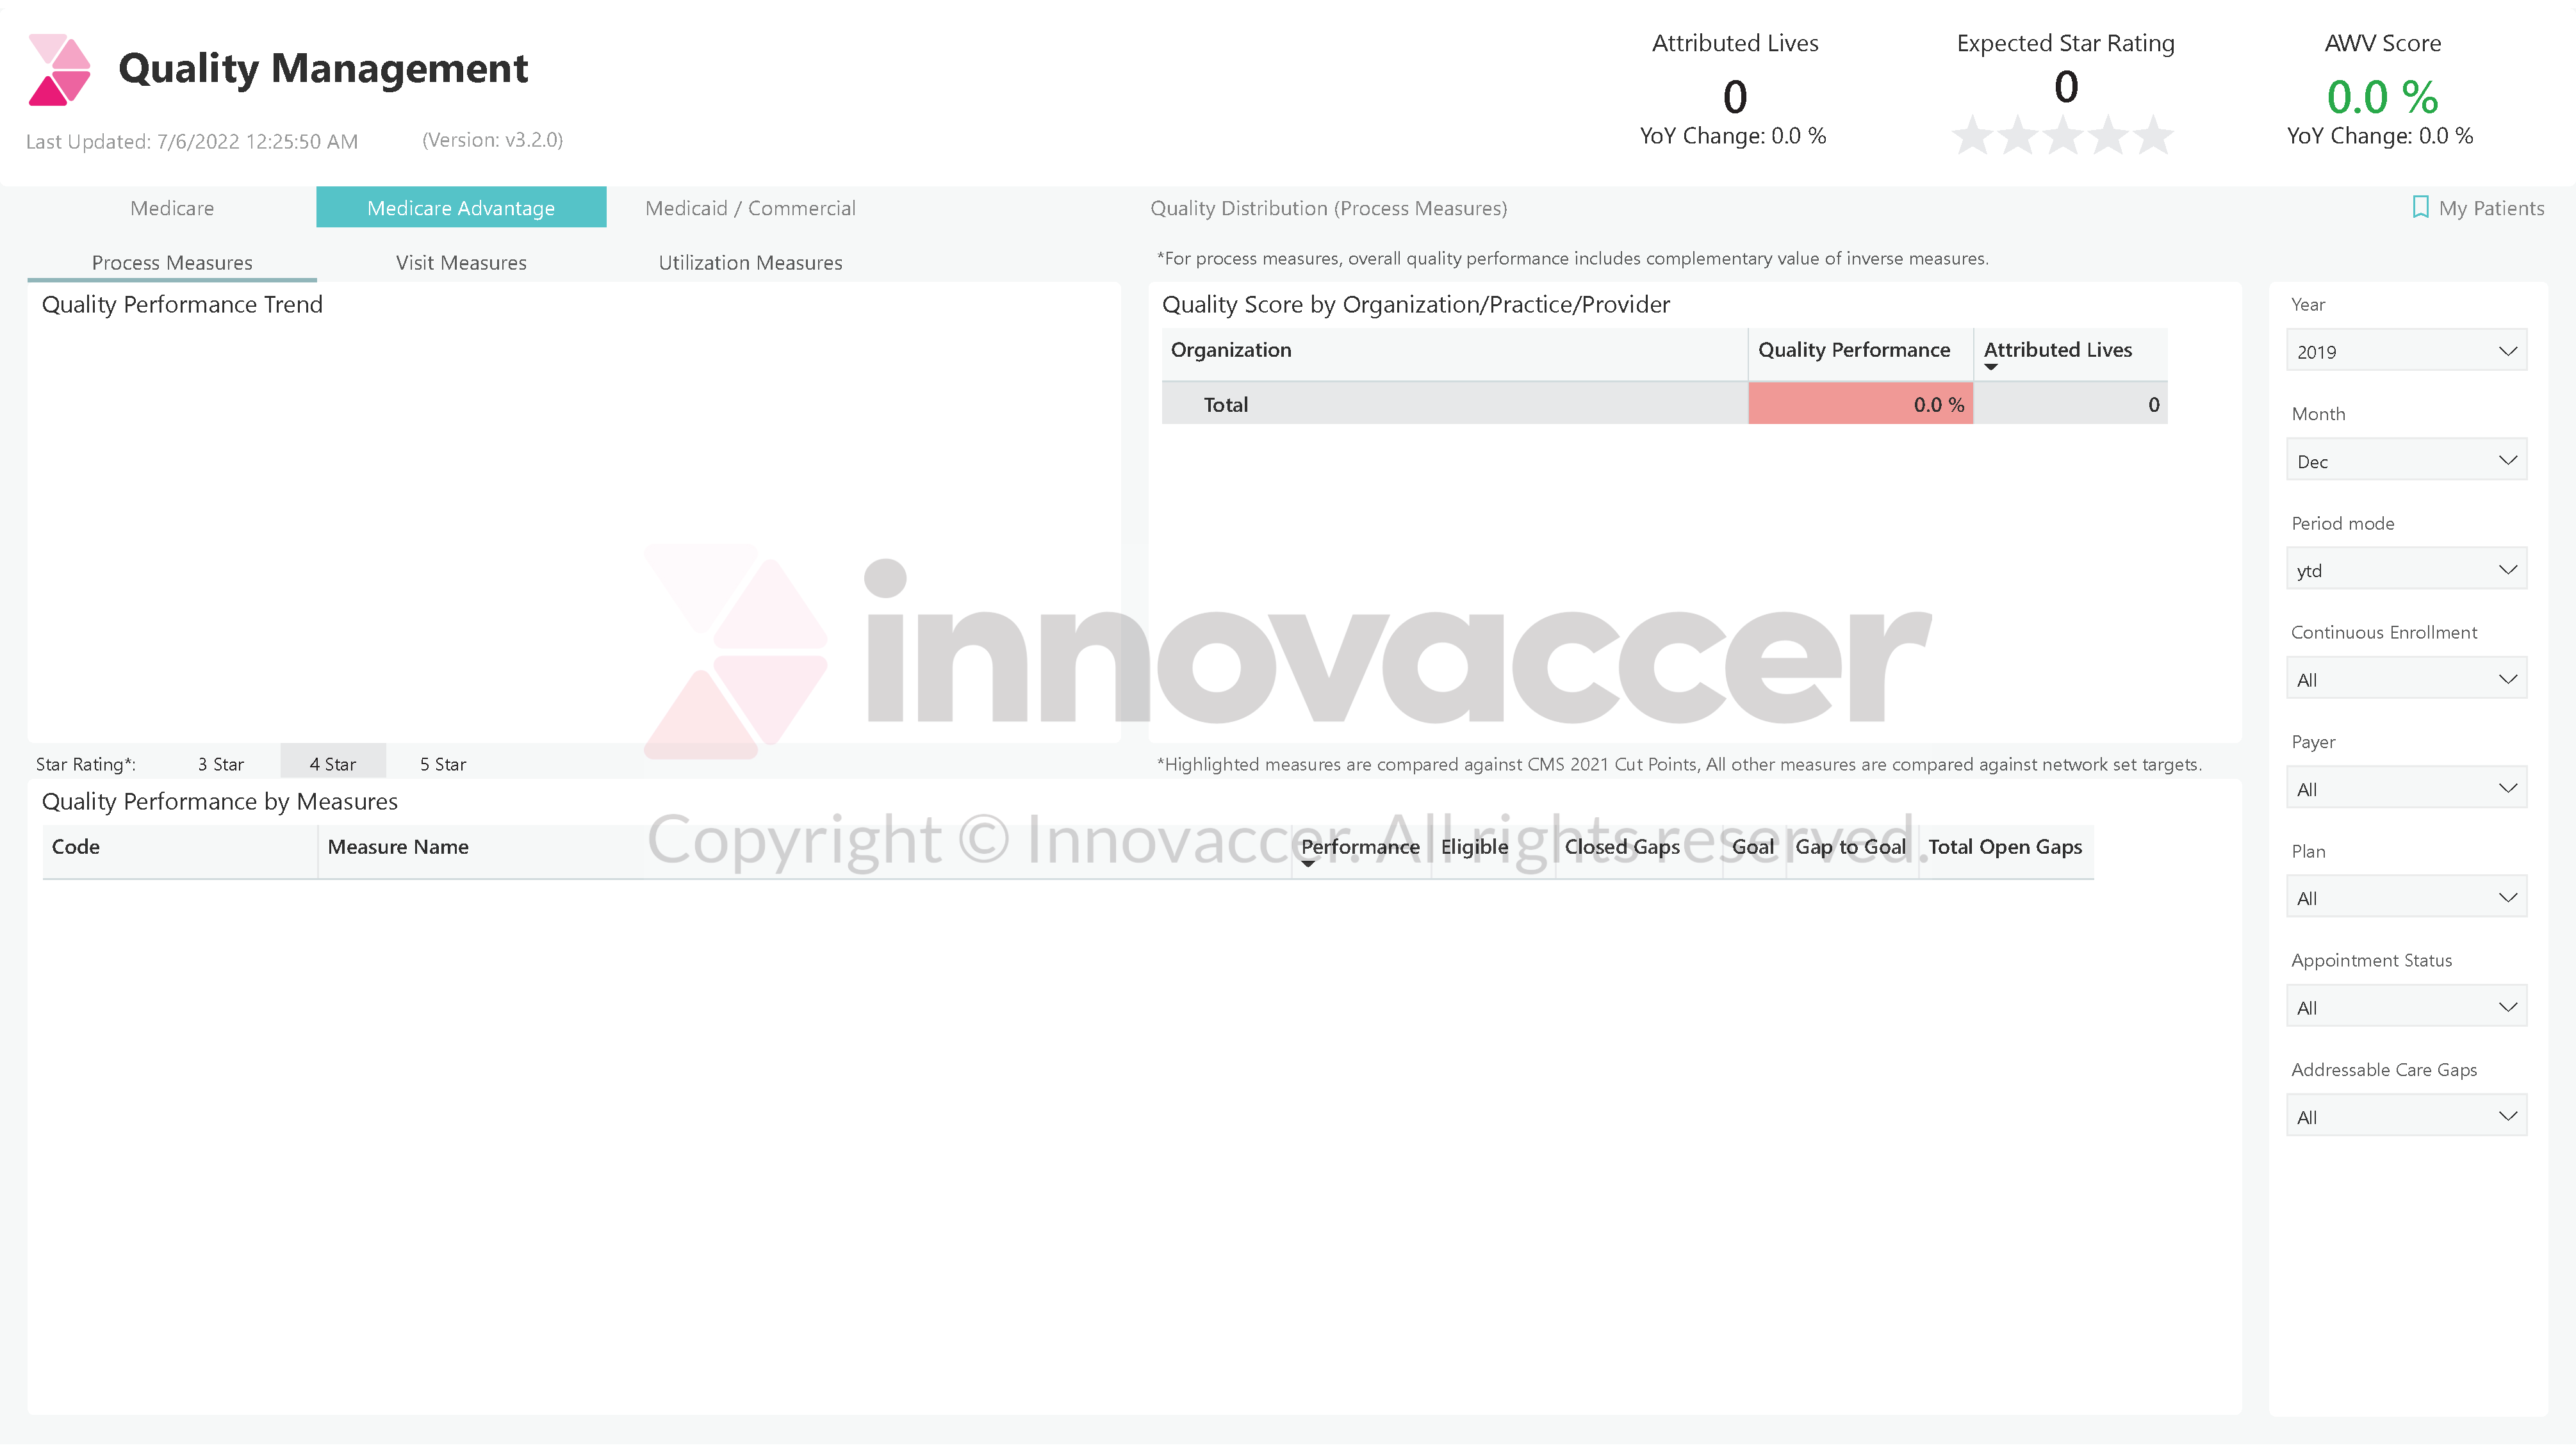
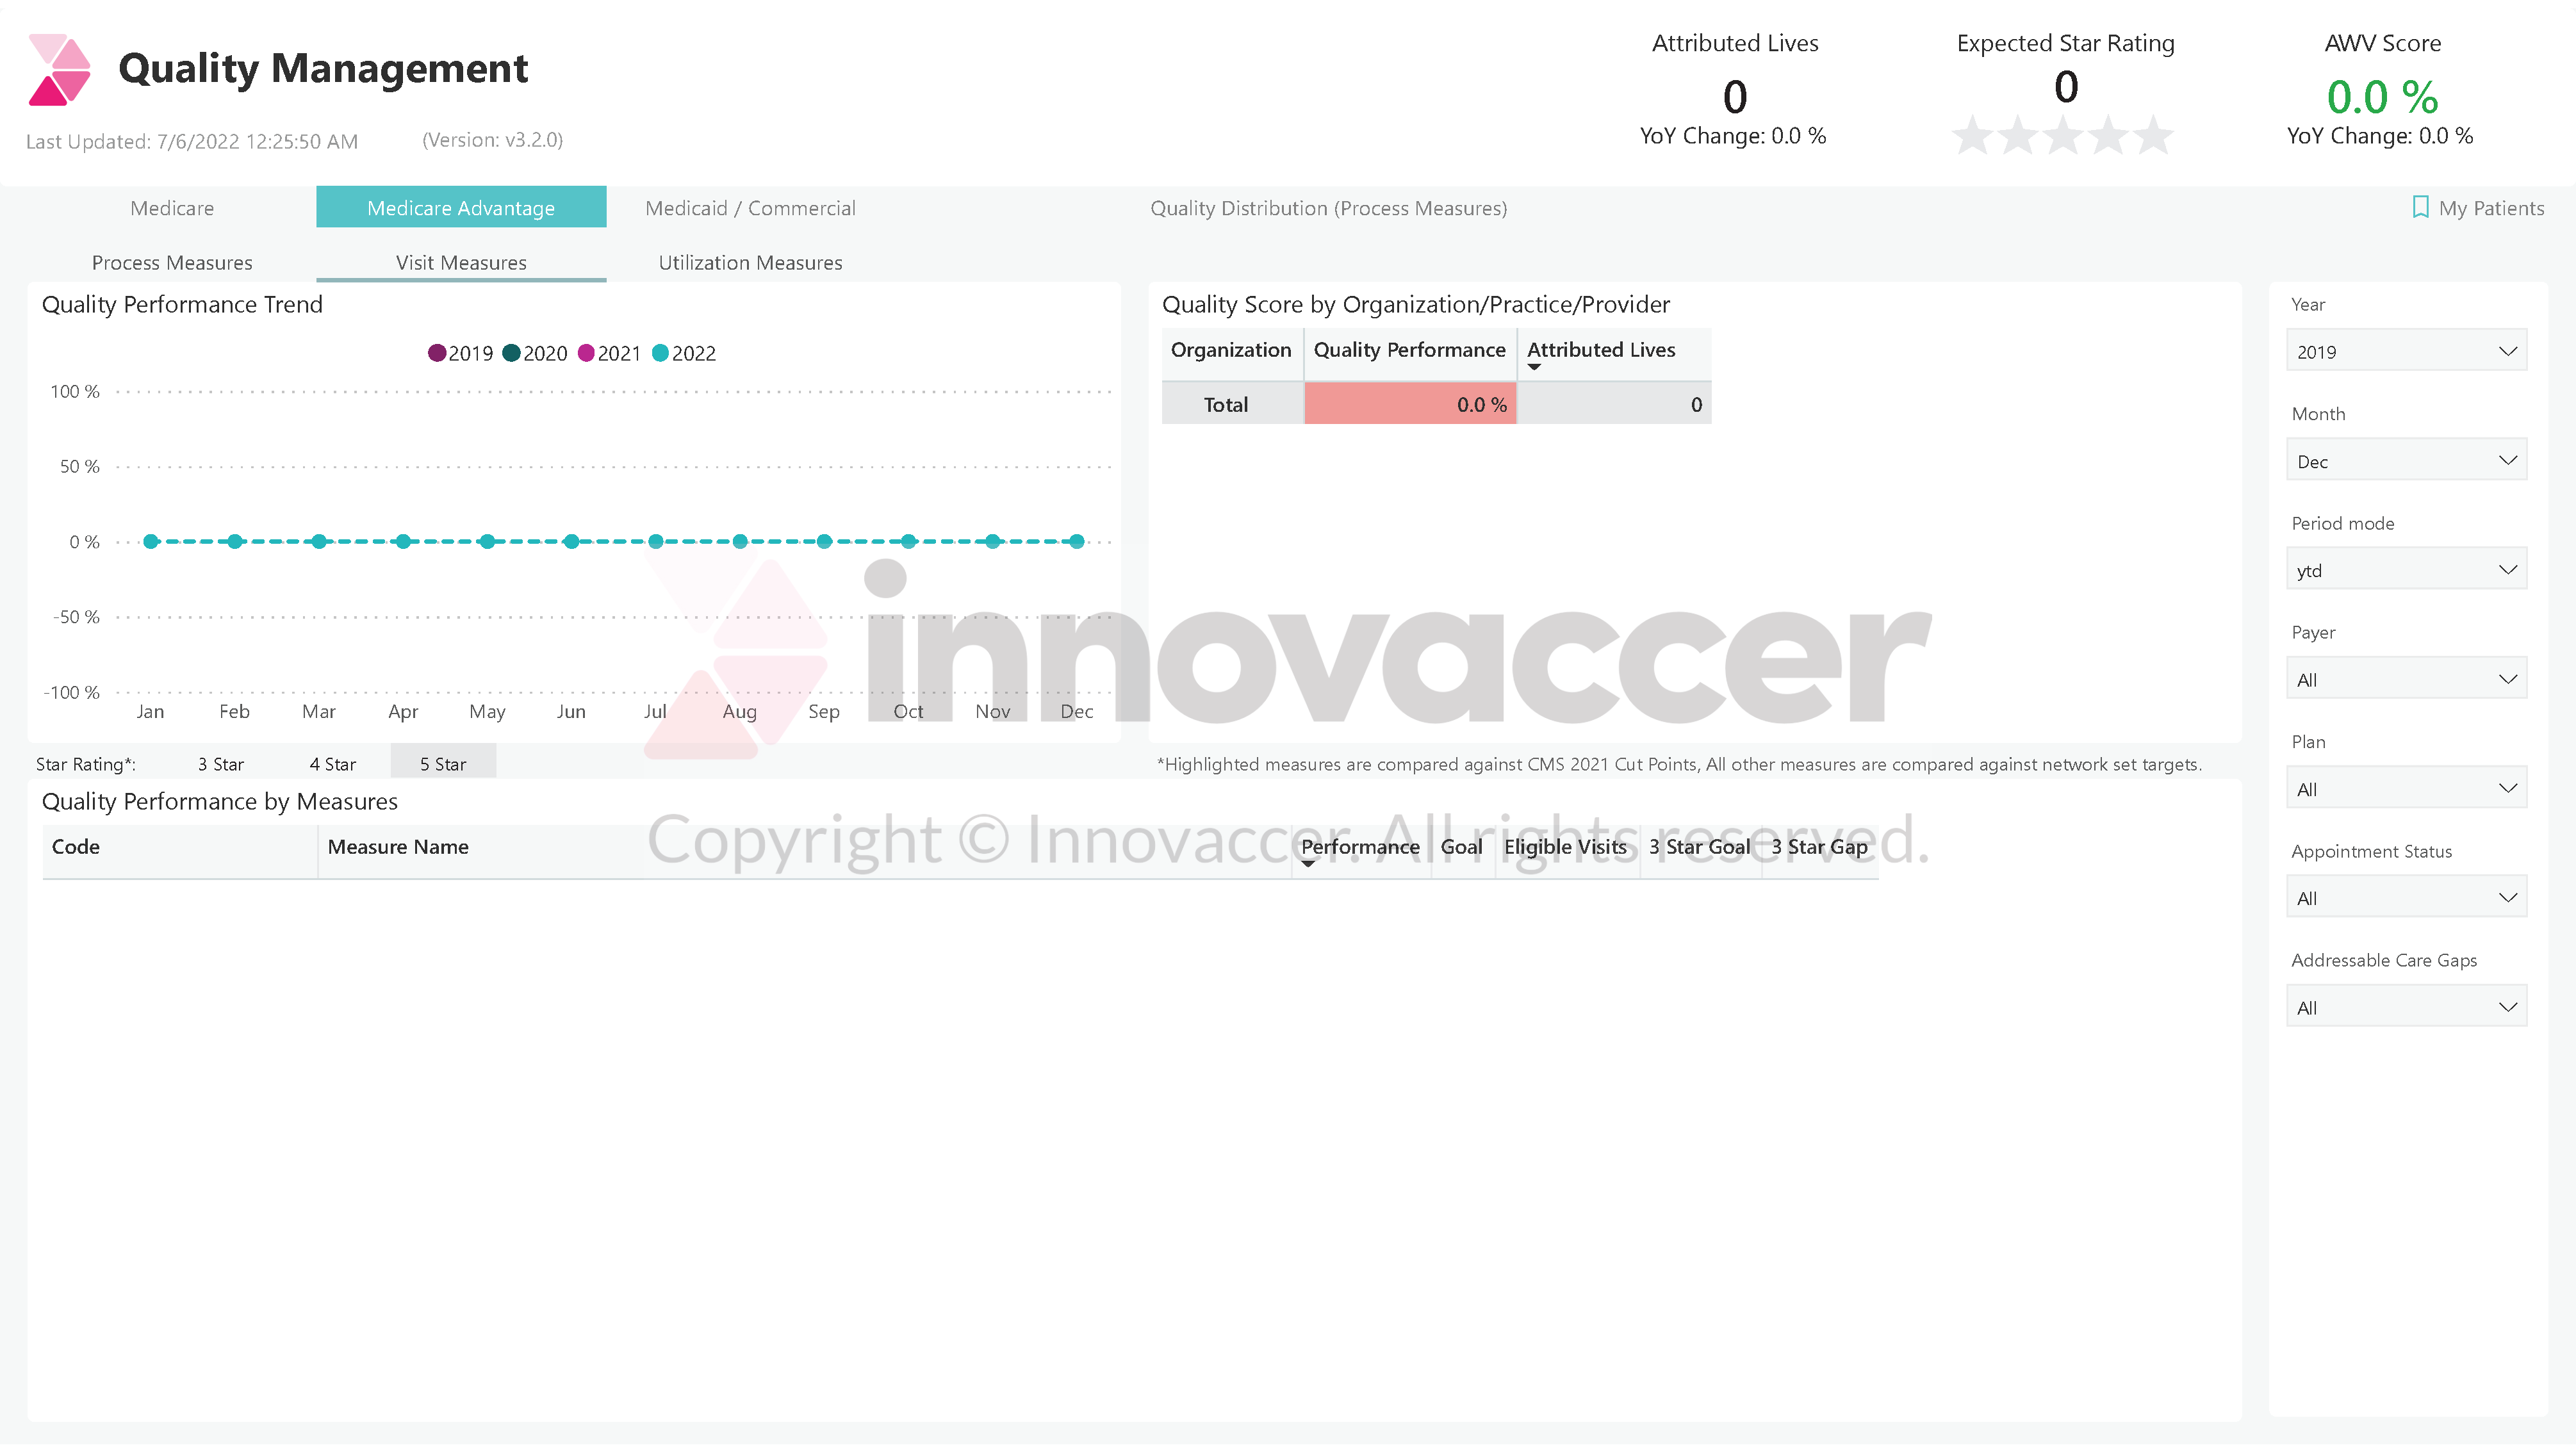
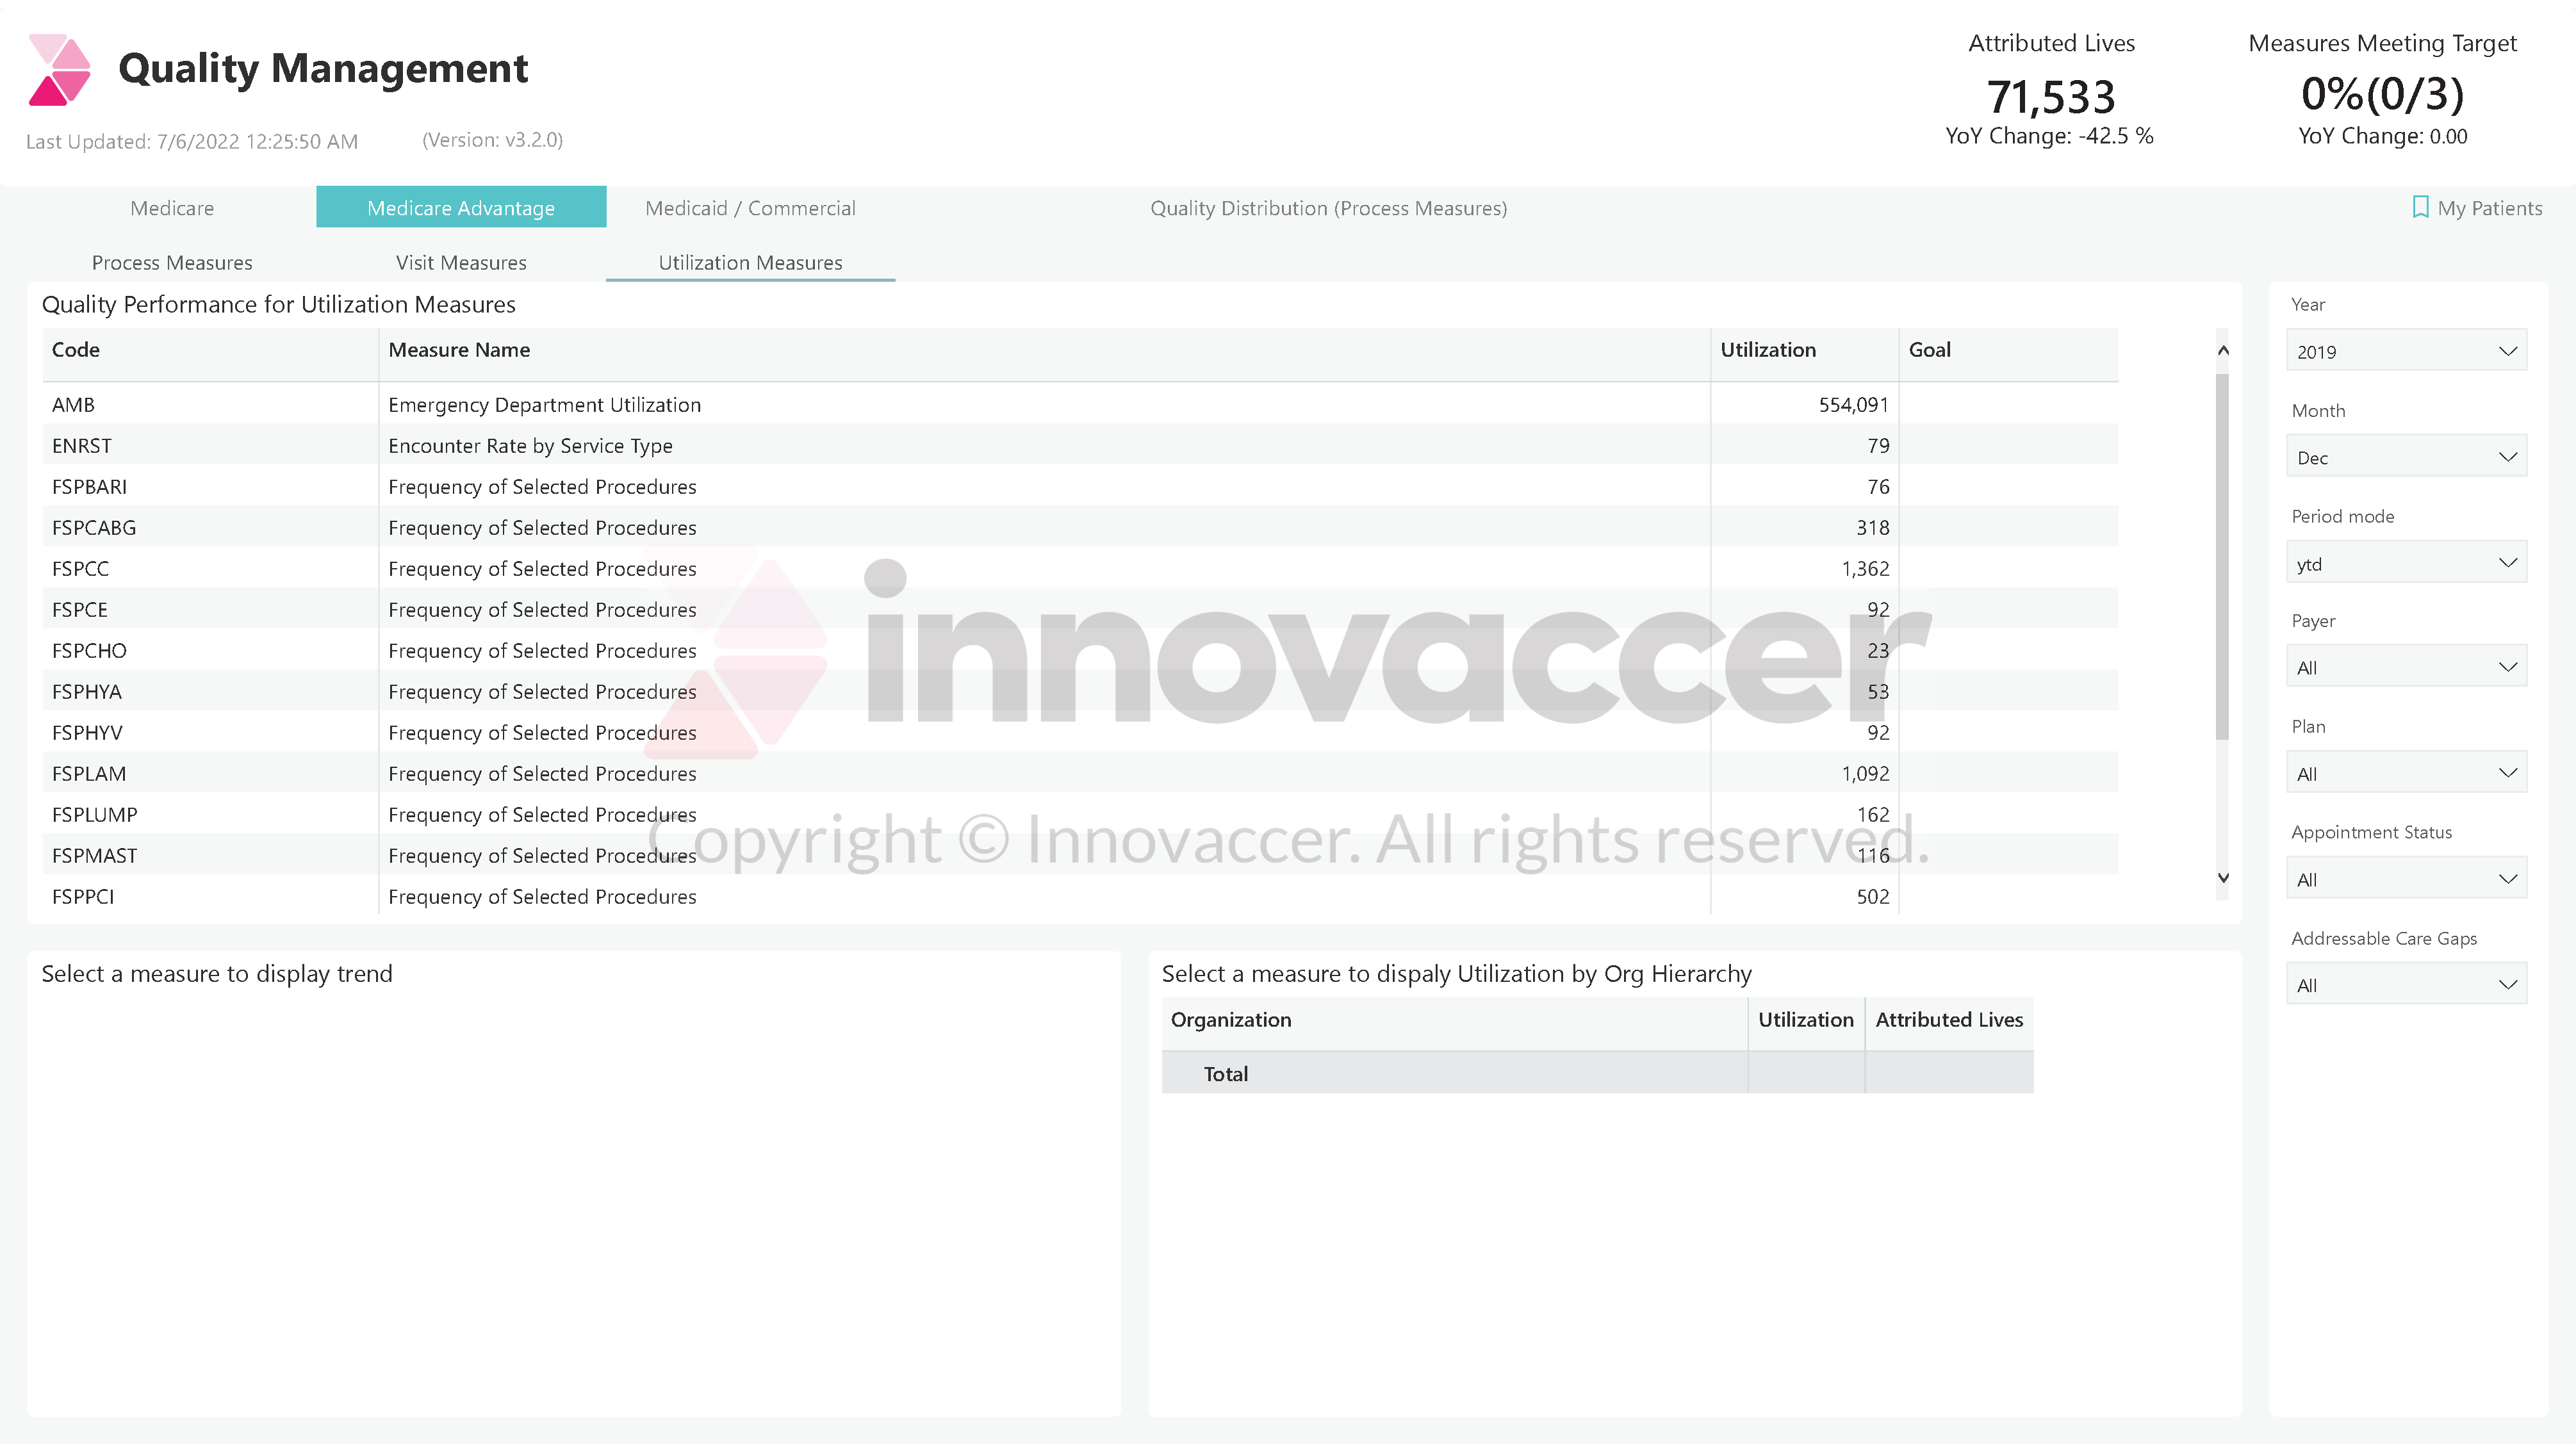
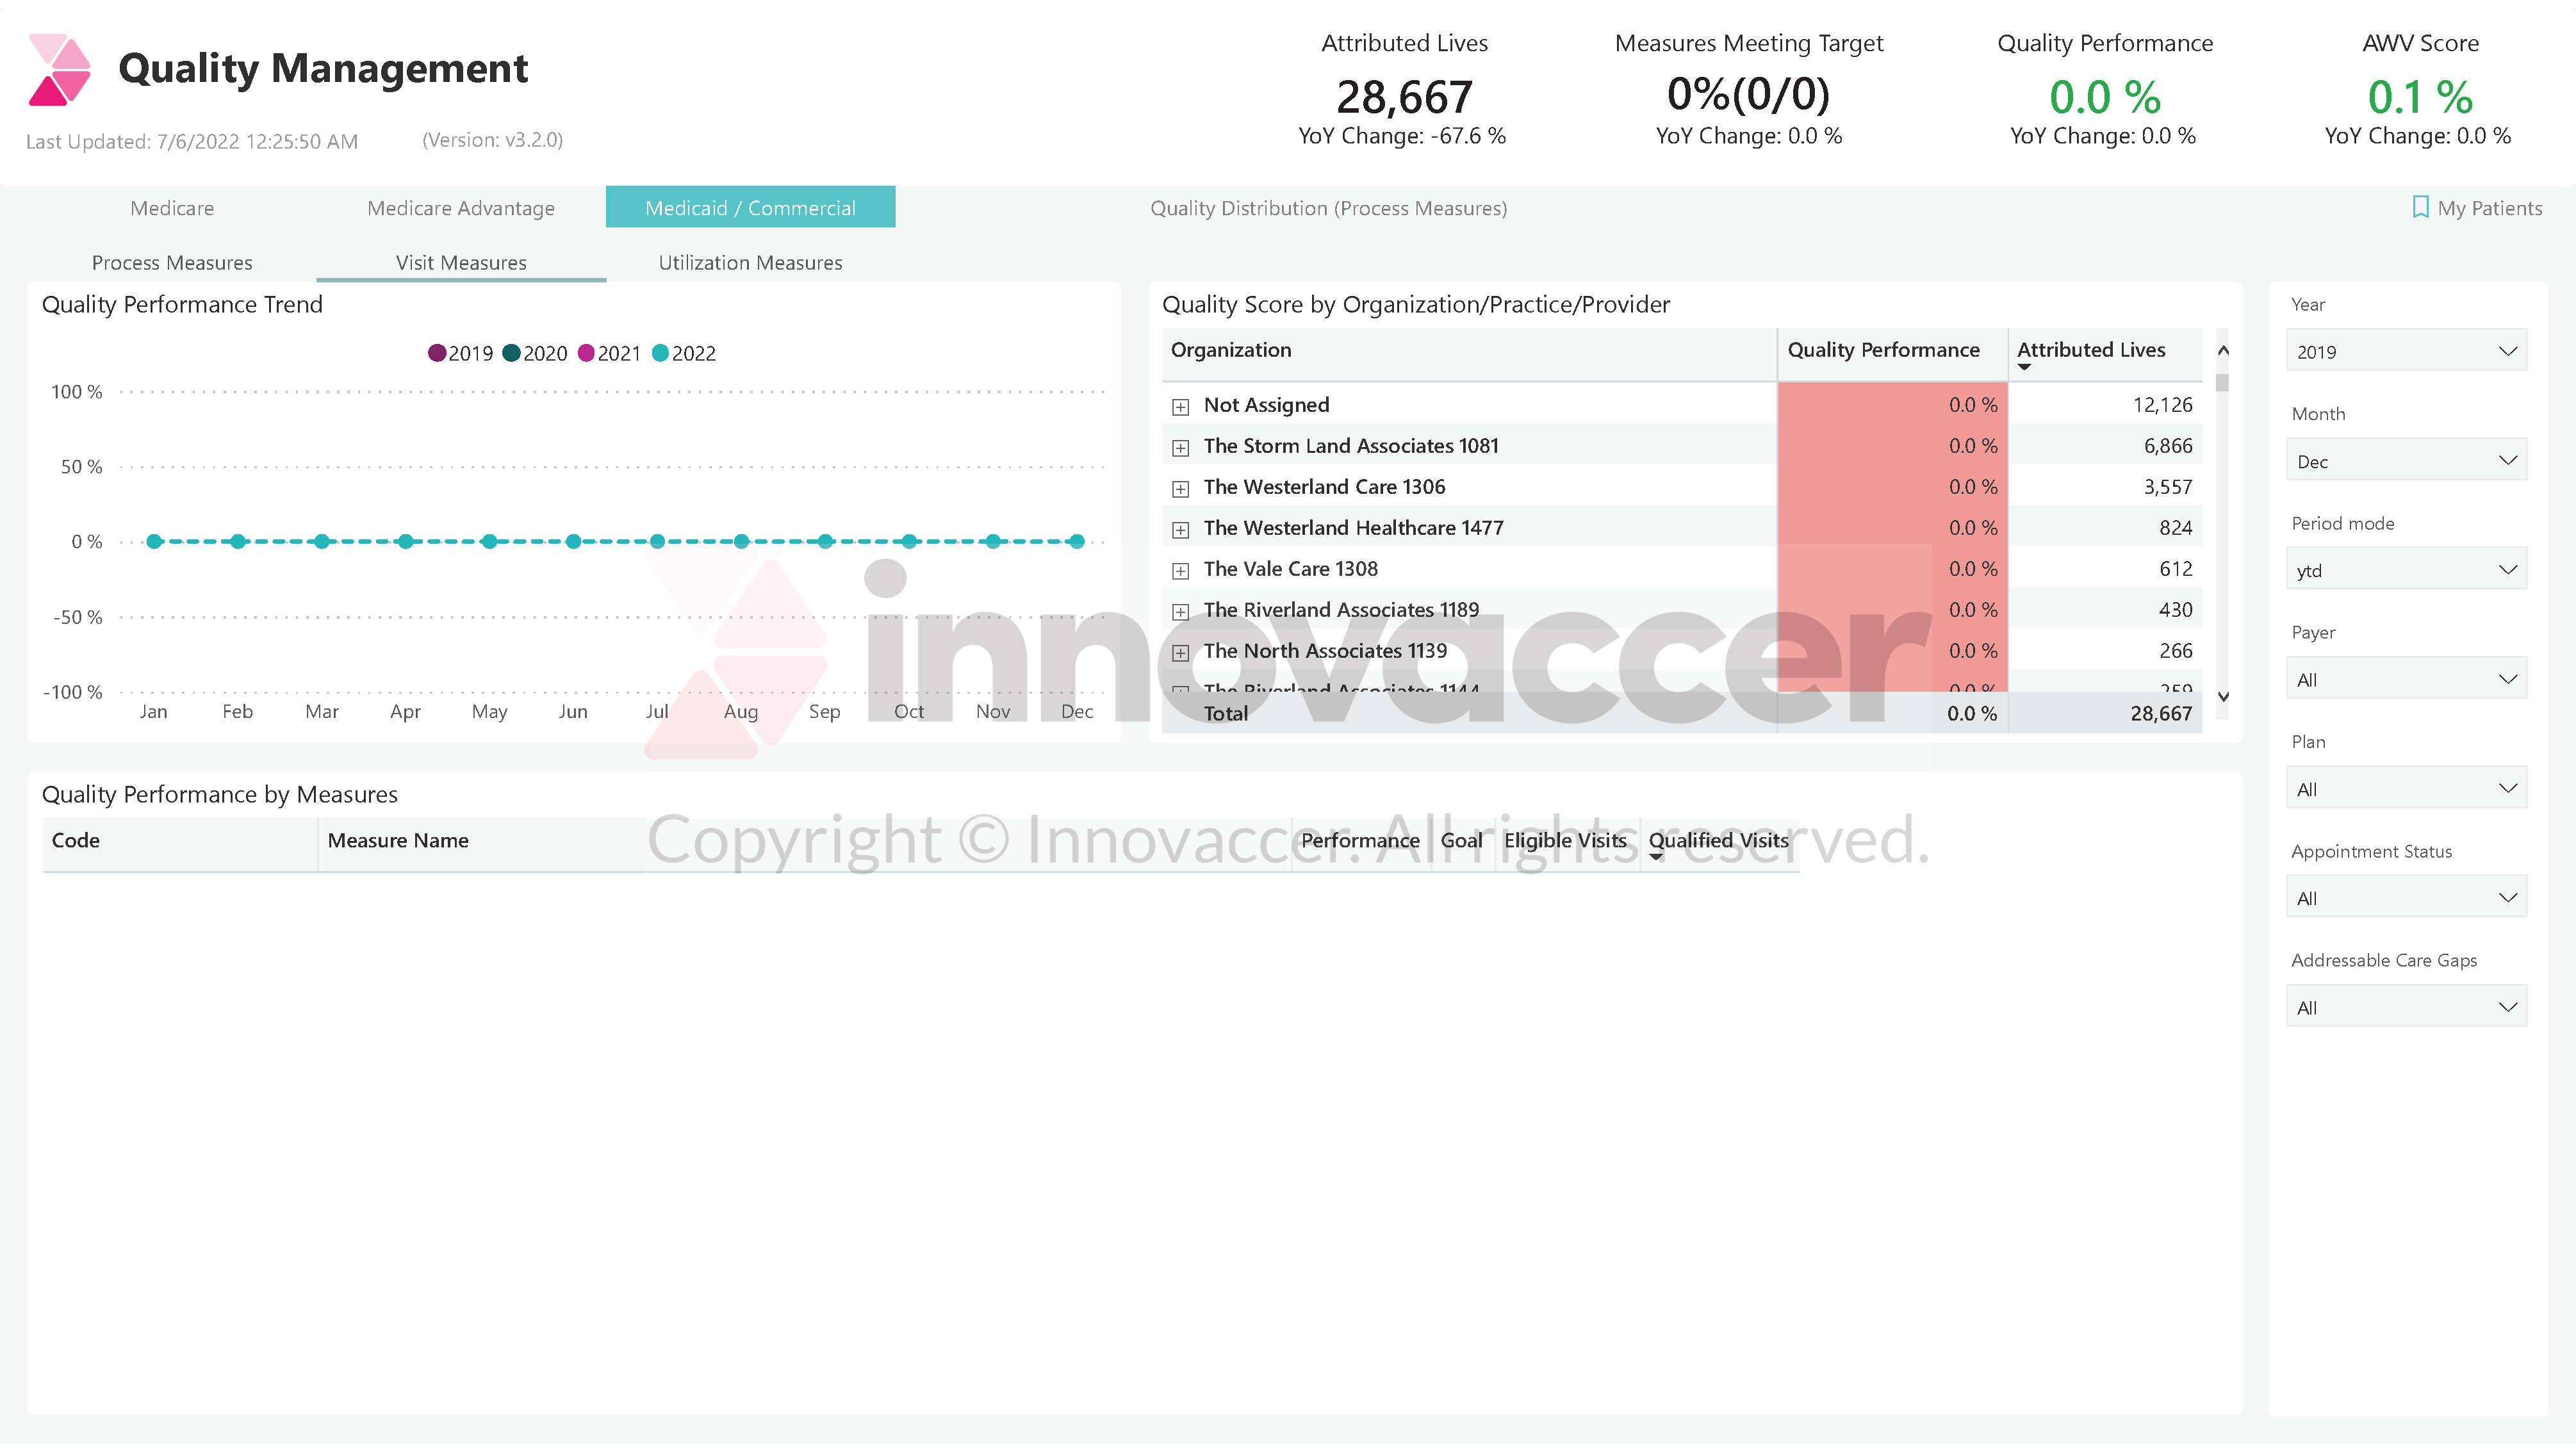
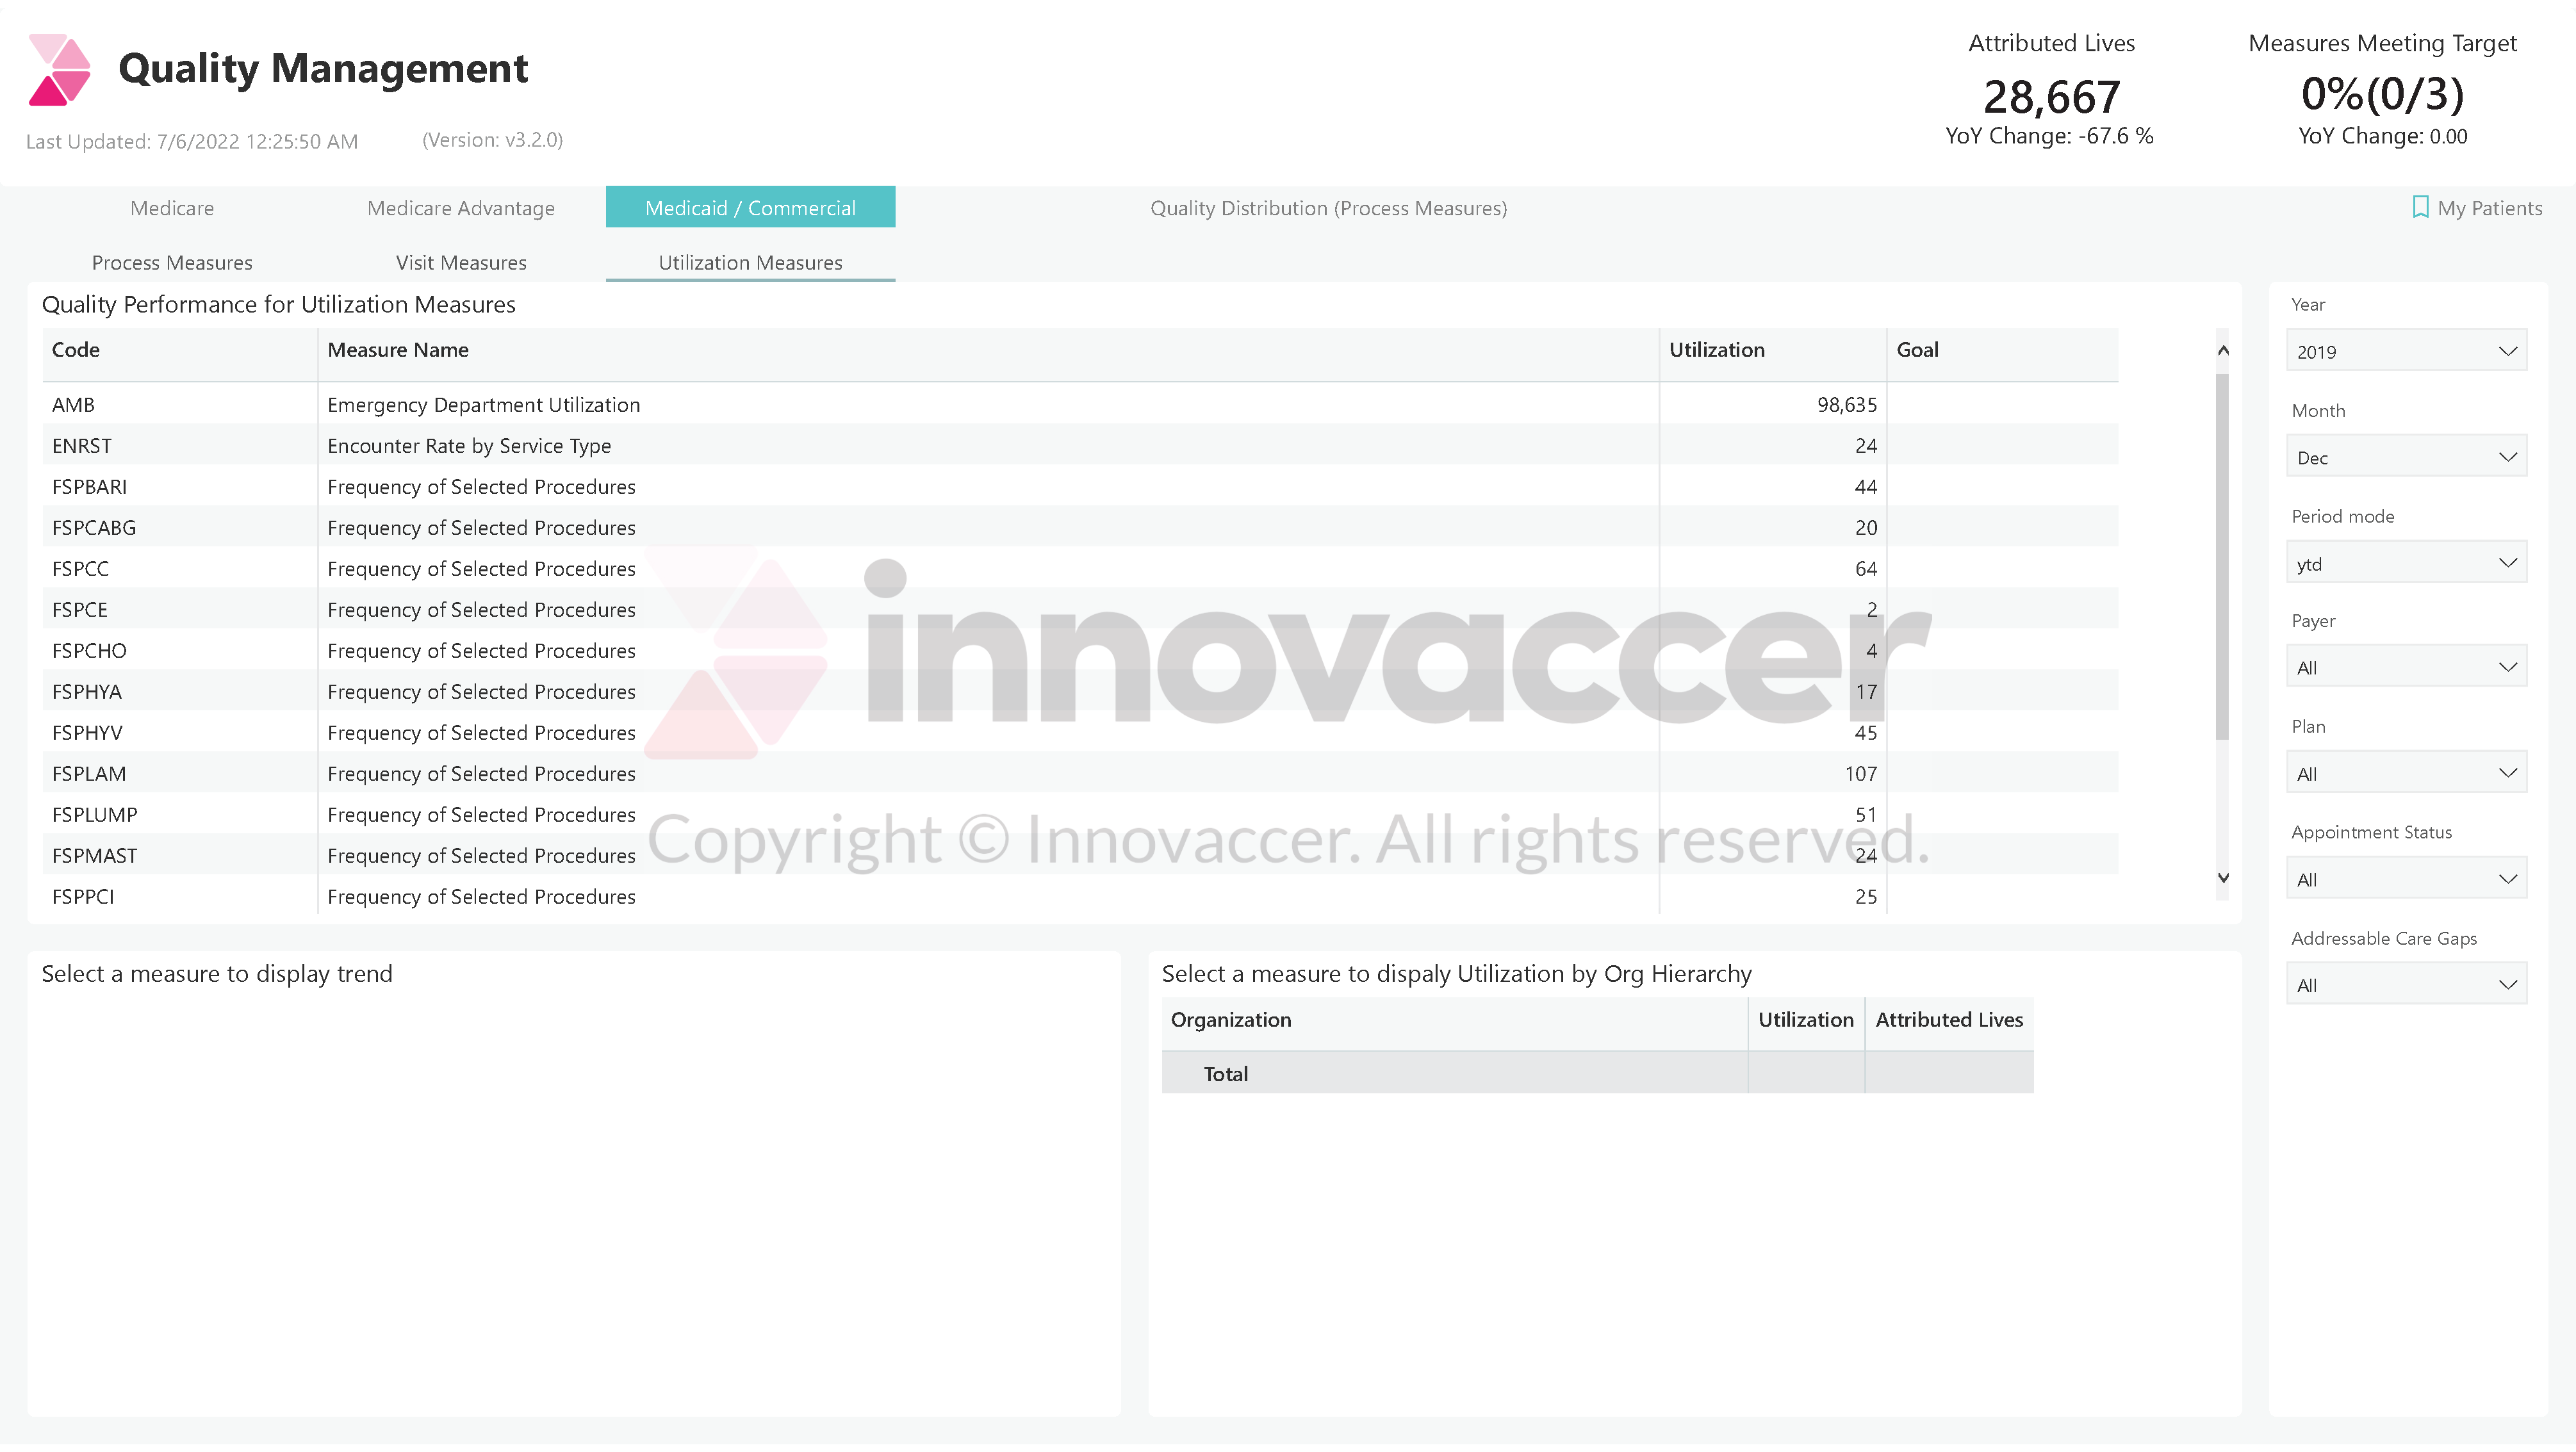
CHCs should also consider the various audiences that need access to calculated rates, on what cadence, and how the data could be best displayed for that audience. For example, CHC leadership and board of directors may need formal presentations of results that align with their meeting cadence. Care teams should have frequent at-aglance access through tools such as dashboards to proactively monitor care and identify opportunities for improvement.
Data visualization is a best practice to display complex sets of data because it supports understanding of concepts and identification of new patterns. To develop a data visualization approach, CHCs should:
- Understand the data.
- Determine what kind of information the CHC wants to communicate.
- Know each audience and understand how they process visual information.
- Use a visual that conveys the information in the best and simplest form for the given audience.
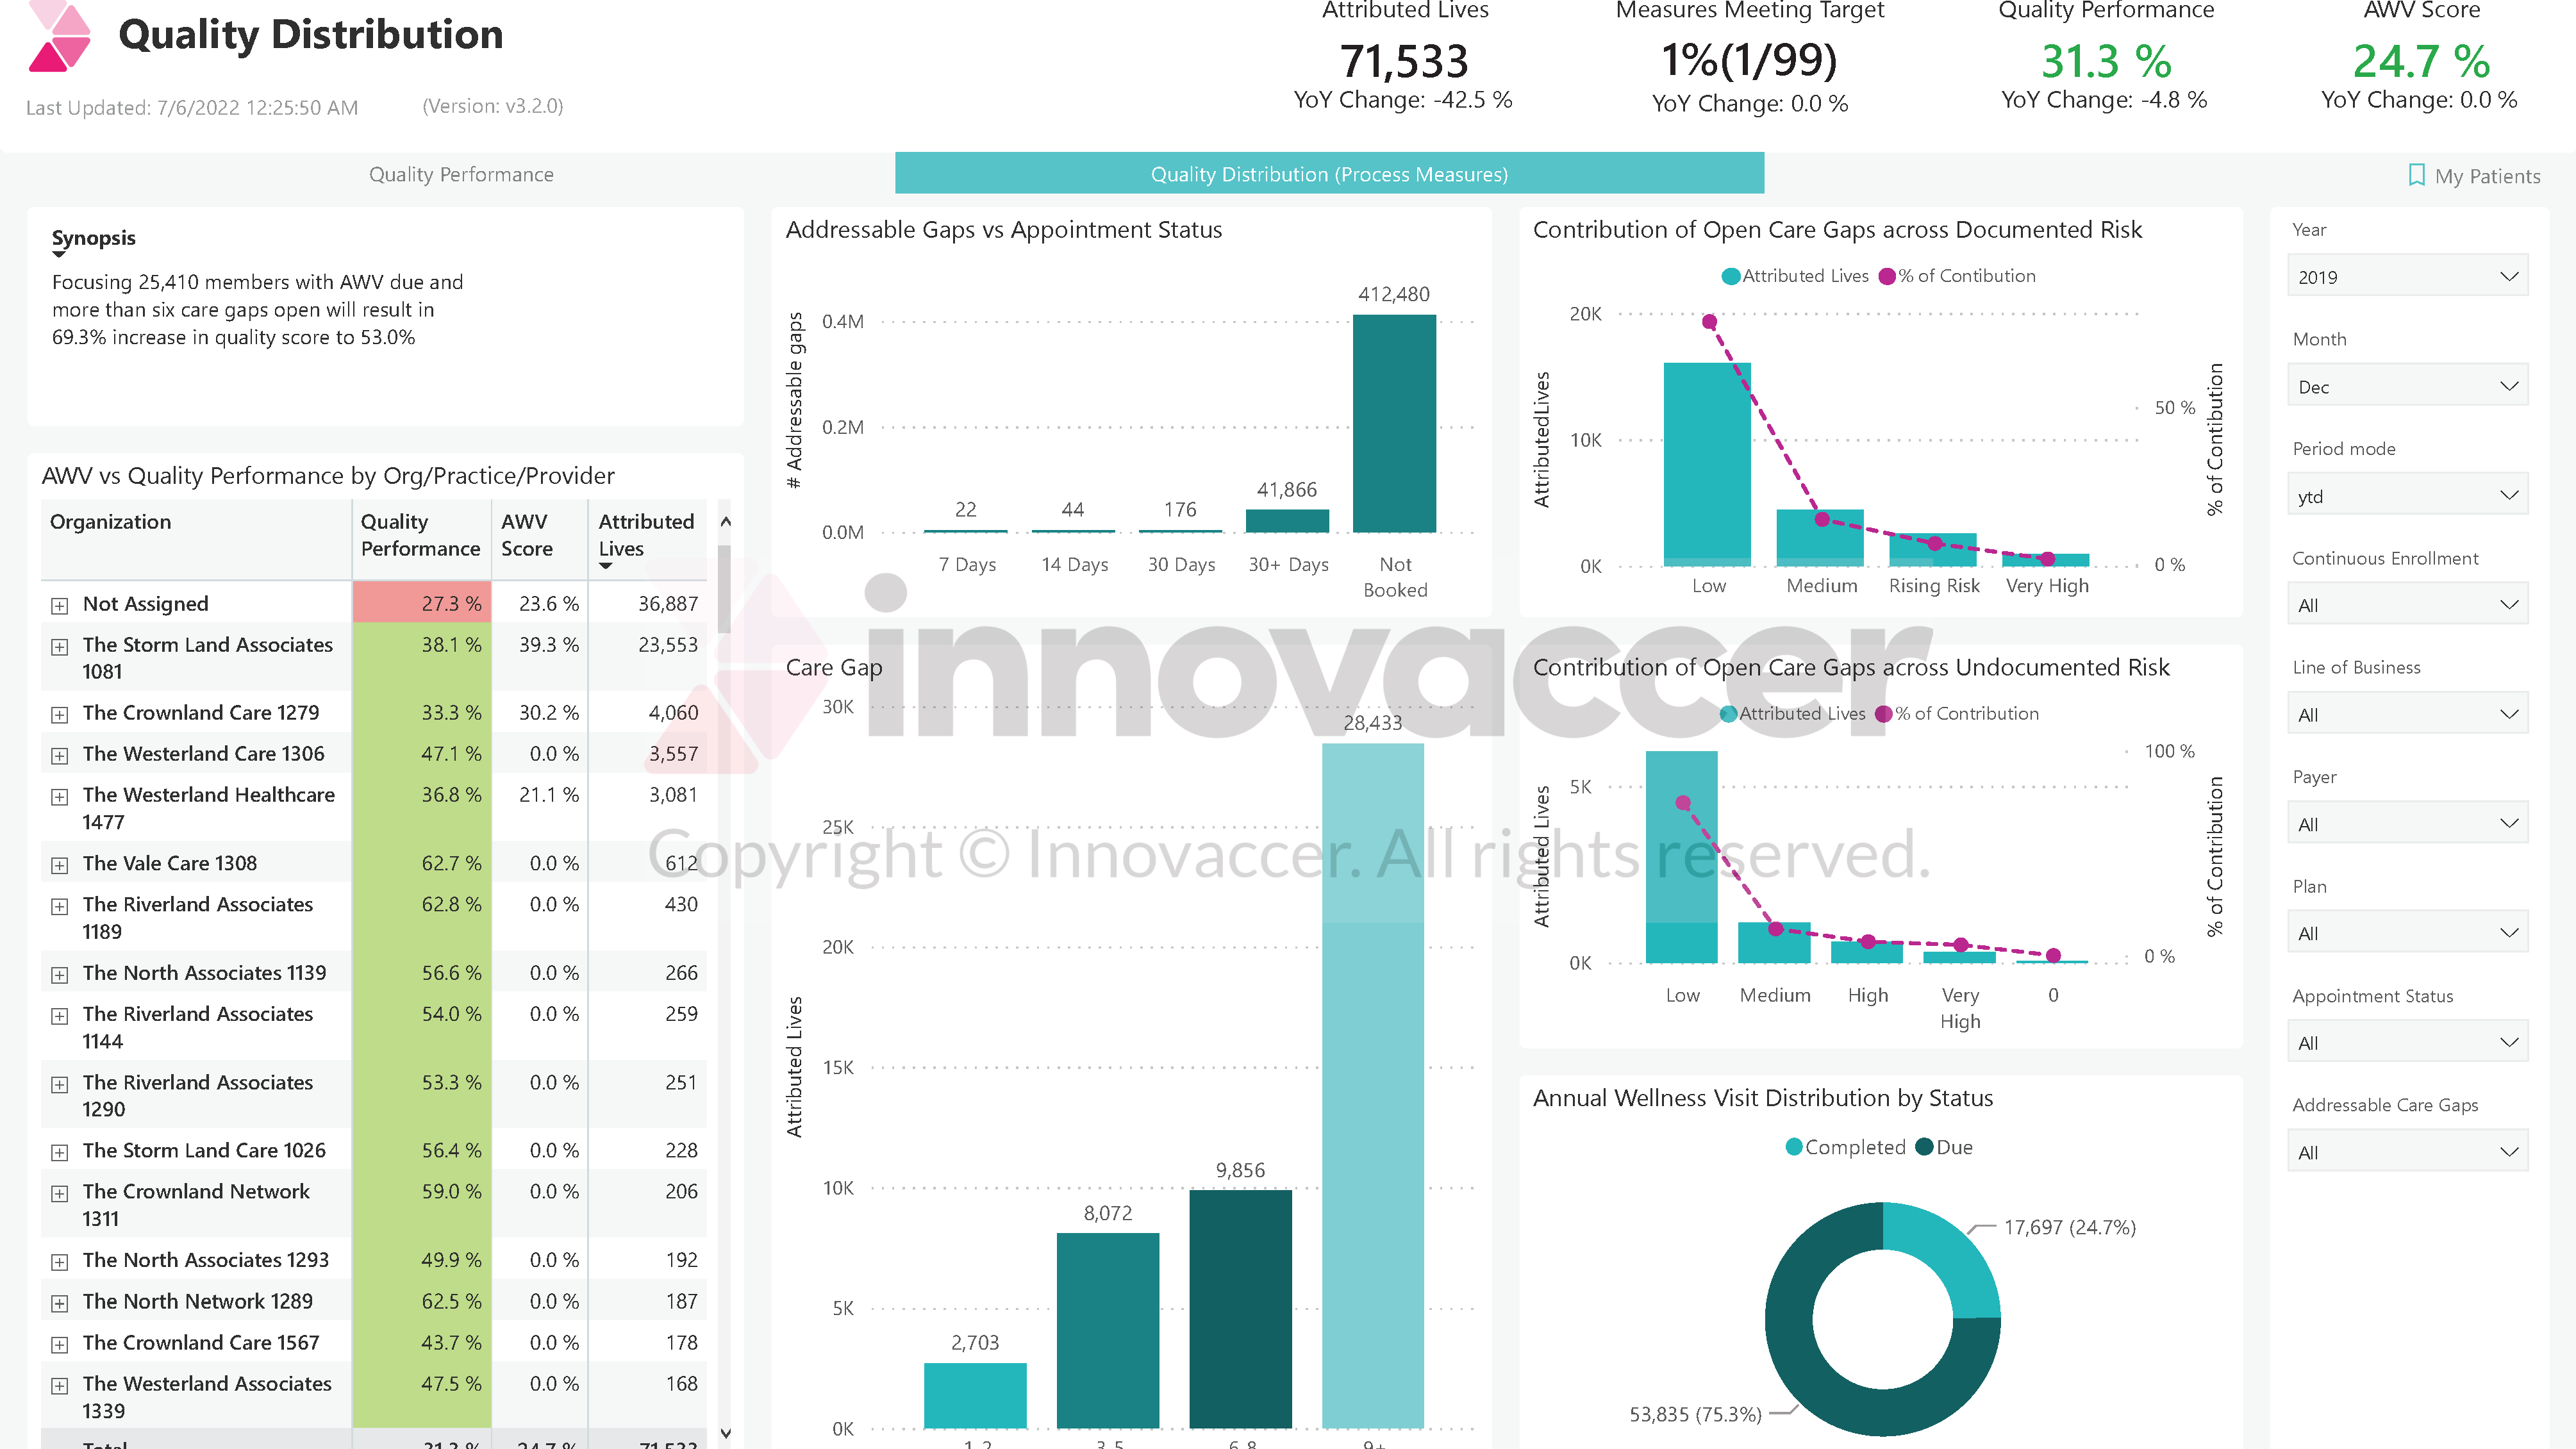
An example dashboard is provided below.
Appendix A: A Sample Dashboard
