
Building the Foundation
Voices From the Field
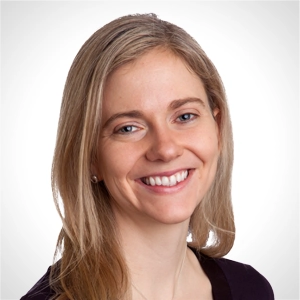
Jodi Pekkala, MPH
Jodi Pekkala is a researcher and consultant with over 15 years of experience in evaluation, quality improvement and practice transformation. She is a Patient-Centered Medical Home Certified Content Expert™ (PCMH CCE™) who assists primary care practices through the various stages of transformation and quality improvement using individualized on-site technical assistance and virtual and in-person learning events. As a certified HEDIS compliance auditor (CHCA), she led annual audits of health plans and possesses in-depth knowledge of HEDIS data collection, measurement and reporting processes.
Q: What do you see as the current innovations in data quality and reporting?
A: Data quality and reporting is going towards digital quality measurement and using measures that pull data directly from the EMR rather than through supplemental files, claims or chart review. This is particularly important for measures that rely on clinical data. For example, metrics that focus not just on HbA1c process measures but the actual results of those tests. Using claims or supplemental files is messy, incomplete and potentially very labor intensive.
In digital quality measurement, we are able to pull data directly from the digital files, combine that information with data pulled from health information exchange platforms so that we’re able to access data from other providers, and see a more complete picture of a person’s care experience and health. The greatest impact for this innovation lies in not only having much easier access to complete data, but also using it in an interactive way with dashboards and drill-down reports to really understand what is happening with different segments of the population.
There is a real strategic opportunity with all of this high-quality, timely information to look at population risk levels, stratify the highest risk segments, and use that information to address gaps in care and design interventions accordingly. Ideally, you’re able to do it through these sophisticated platforms that allow for interactive dashboards, but there are also more accessible ways to do it, depending on the resources available to your practice. For example, using Excel spreadsheets, if that’s what’s available. This is really about understanding how to look at your population as a whole and systematically deploying your resources to maximize impact for improvement.
Q: What do you find particularly exciting or interesting relating to data, quality and reporting for advancing health equity right now?
A: Having better access to race, ethnicity and language (REAL) and sexual orientation and gender identity (SOGI) data, to be able to analyze population data for disparities. Of course, it’s not just about monitoring, but then dedicating resources to address disparities. Data quality and reporting isn’t innovation, it’s just that critical first step to identifying where your disparities lie and doing something about it.
Q: What are the new technologies that you are excited about for data quality and reporting?
A: There are emerging opportunities to use artificial intelligence to assess and target patient risk levels. For instance, with mammograms, there are changing general guidelines, but there are much more specific guidelines that can be rendered based on additional and specific information about individual people and populations. In the future, we’ll be able to use artificial intelligence to get much more targeted guidelines, rather than relying on generalities that are much more appropriate for some populations than others.
Remote patient monitoring is another new and exciting input for patient-level data, although there are some significant implementation challenges to utilizing it in the most effective way. Remote patient monitoring requires a lot of tech literacy and engagement on the part of the patient population, which is more challenging to overcome than figuring out how to distribute the technology itself. Another challenge with this technology is getting the data to the provider at point of care, which is much more complex than getting the data from the patient’s device back to the vendor. A specific example where we can see remote patient monitoring working well is through the CenteringPregnancy program, where there are new efforts to support women to take their own blood pressure measurements at home and then use telehealth to increase rural access to care.[1]
Q: What do you see as the biggest challenges for data quality and reporting?
A: There are enormous challenges to understanding and using the data at the provider level. It’s a culture shift, and a hard one to make when you have more patients than slots available.
One significant aspect of this challenge is getting people to accept that these data are true. People look at their rates and say, “That’s not accurate. I know. I provide that care.” You have to have a deep understanding of your data and what goes into it; what is in the numerator and the denominator. You really need to understand the minutiae of the measure. If the numerator requires compliance within two years, if you do it in two years plus one day, you don’t get the credit. If the parent refuses, you don’t get credit. You have to really understand what’s in and what’s out. For example, if there is a vaccine allergy, you can get credit, but it needs to be documented in the chart. You need to measure quality and you need to improve quality, because you are getting paid on quality. You need to get more laser focused on your interventions and measurement of improved outcomes. We all recognize that the outcomes are harder to measure and assess, but that is where the system is headed.