
Building the Foundation
Version 3 – June 2026
Key Activity 2: Develop data and reporting capabilities to implement and manage empanelment and panel data.
Empanelment is a data-intensive process and requires adequate health information technology (HIT) resources for both initial implementation and ongoing maintenance. Resources are required for information system configuration and the personnel to manage, report and refine panel data.
1. Identify HIT leadership and team resources to serve as partners in designing, validating and providing ongoing reporting relevant to empanelment.
Practices may choose an analytics specialist to serve as the lead on empanelment. If an operational or clinical staff member is chosen instead, recruit adequate data and analytics partnership so that the necessary validated business intelligence reports are available ongoingly. While the specifics may vary significantly between organizations, establishing adequate partnership and commitment of HIT resources is critical to the success of empanelment and panel-driven population health management.
2. Develop and monitor reports.
Although there are a wide range of reports that may be useful for managing empanelment, practices should prioritize developing reports that correspond with Empanelment Implementation Guide 10 their own empanelment process measures. Empanelment process measures can help reduce the percentage of patients without an assigned primary care provider, as well as increase the frequency of patients seeing their own provider and providers seeing their own patients. In addition to using empanelment process measures, you should consider developing the capability to report all of your quality data at the panel level so that care teams have specific, actionable data to use for quality improvement and population health management purposes.
Suggested empanelment metrics include:
- Empanelment: Percentage of patients who are assigned to a provider and care team.[1]
- Numerator: Number of patients with a PCP attributed by the practice.
- Denominator: Total number of established patients, including all managed care assigned patients.
- Suggested initial target: 90%.
- Continuity (Patient Perspective): Percentage of patient visits with attributed provider and care team.[2]
- Numerator: Number of patients seen by provider X who were empaneled to provider X.
- Denominator: Total number of primary care visits for patients empaneled to provider X.
- Suggested initial target: More than 80%.
- Appropriate schedule utilization (Provider Perspective Continuity): Percentage of visits that provider sees patients assigned to them.[3]
- Numerator: Number of patients seen by provider X who were empaneled to provider X.
- Denominator: Number of patients seen by provider X.
- Suggested initial target: This depends!
Goals for appropriate schedule utilization can vary by provider and practice. If a provider is temporarily covering for another provider who is on vacation or leave, it may be appropriate for the other provider’s patients to be scheduled with them. However, if provider X has a full patient panel but is seeing a significant number of other provider’s patients, this may lead to provider X’s actual patients not being able to schedule with provider X in a timely manner. This creates a snowball effect as provider X’s patients are scheduled with other providers or are scheduled too far into the future.[4]
See the Reports Necessary for Ongoing Empanelment for descriptions of core reports necessary for empanelment. Additional guidance on generating reports can be found in the PHMI Empanelment Fundamentals e-learning.
Using Empanelment for Informed Decision Making: Examples
The following examples can be considered and used when developing a program to monitor empanelment and access. Each report helps to provide a comprehensive perspective of whether a provider is adequately empaneled or if there is availability for additional patients on a particular provider’s panel. Practices should develop target values to benchmark providers’ data to determine if action is required.
The below dashboard serves as an example of a patient panel report.
Figure 1: Example Patient Panel Dashboard
Provider Information |
Panel Patient Count |
Continuity & Access |
Productivity |
||||
First name |
Last name |
Clinical FTE |
Panel patient count per FTE: activity in last 18 months |
Patient perspective continuity |
Provider perspective continuity |
TNAA for routine follow up, days |
Patient visits per hour (per session works) |
Example |
Provider |
0.8 |
1300 |
40% |
60% |
32 |
2.3 |
Number |
Two |
0.5 |
2000 |
30% |
80% |
48 |
2.2 |
Third |
Case |
1.0 |
1400 |
65% |
55% |
7 |
1.7 |
After a panel report is established, a panel should be evaluated on its fullness, then regulated accordingly to address new patient slots. It should be noted that operational issues can cause full panels to appear not full, or near full to appear over full. A dashboard can help identify these operational issues.
Figure 2: Assessing Panel Fullness*
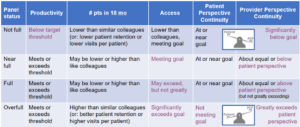
* Key metrics for determining the status in a row are in PURPLE
3. Establish a process to reconcile health plan assignment data.
As alternative payments become more closely linked to population parameters set by health plans, health plan assignment of patients to providers becomes more consequential to both quality metric performance and revenue. Discrepancies often occur between payer assignment and provider-level attribution of empaneled patients. In a fee-for-service environment, these discrepancies may simply create irritation and confusion for the patient and the provider. In the context of value-based payment, the problems caused by this mismatch in payer assignment and practice attribution increase.[5] Working with payers to reconcile assignment and attribution mismatch is an important step in establishing a value-based payment arrangement.
Endnotes
- Snyder DA, Schuller J, Ameen Z, Toth C, Kemper AR. Improving Patient-Provider Continuity in a Large Urban Academic Primary Care Network. Acad Pediatr. 2022;22(2):305-12.
- Institute for Healthcare Improvement. Care Team Member / Patient Continuity: Review of Schedule. Boston: IHI; [September 11, 2023]. Available from: https://www.ihi.org/resources/Pages/Measures/ TeamMemberPatientContinuityReviewofSchedule.aspx.
- National Association of Community Health Centers. Population Health Management Empanelment Action Guide. Bethesda: NACHC; 2022 [September 11, 2023]. Available from: https://www.nachc.org/wp-content/uploads/2022/06/Empanelment_PopHealth-Mgmt_Action-Guide-April-2022.pdf.
- National Association of Community Health Centers. Population Health Management Empanelment Action Guide. Bethesda: NACHC; 2022 [September 11, 2023]. Available from: https://www.nachc.org/wp-content/uploads/2022/06/Empanelment_PopHealth-Mgmt_Action-Guide-April-2022.pdf.
- National Academies of Sciences Engineering Medicine. Implementing high-quality primary care: rebuilding the foundation of health care. Washington, DC: The National Academies Press; 2021.